
 )
or https:// means you've safely connected to the .gov website. Share sensitive information only on official, secure websites.
)
or https:// means you've safely connected to the .gov website. Share sensitive information only on official, secure websites.
- HIGHLIGHTS OF THIS ISSUE
- Part I
- Part III
- Update for Weighted Average Interest Rates, Yield Curves, and Segment Rates
- Part IV
- Amounts Paid for Certain Personal Protective Equipment Treated as Medical Expenses
- Definition of Terms
- Numerical Finding List1
- Finding List of Current Actions on Previously Published Items1
- How to get the Internal Revenue Bulletin
Internal Revenue Bulletin: 2021-15
April 12, 2021
These synopses are intended only as aids to the reader in identifying the subject matter covered. They may not be relied upon as authoritative interpretations.
This Announcement is issued pursuant to § 521(b) of Pub. L. 106-170, the Ticket to Work and Work Incentives Improvement Act of 1999, which requires the Secretary of the Treasury to report annually to the public concerning advance pricing agreements (APAs) and the Advance Pricing and Mutual Agreement Program (APMA Program), formerly known as the Advance Pricing Agreement Program (APA Program). This twenty-second report describes the experience, structure, and activities of the APMA Program during calendar year 2020.
This notice provides additional tax relief under section 7508A of the Code for taxpayers affected by the Coronavirus Disease (COVID-19) emergency. Specified Federal income tax filings and payments due on April 15, 2021, are postponed to May 17, 2021. The filing and furnishing of specified Forms 5498 are also postponed to June 30, 2021. Claims for Federal income tax credit or refund that are expiring on or after April 15, 2021, and before May 17, 2021, are also postponed to May 17, 2021. This notice also postpones the application date to participate in the Annual Filing Season Program.
This revenue procedure provides issuers of qualified mortgage bonds, as defined in § 143(a) of the Internal Revenue Code (Code), and issuers of mortgage credit certificates, as defined in § 25(c), with (1) the nationwide average purchase price for residences located in the United States, and (2) average area purchase price safe harbors for residences located in statistical areas in each state, the District of Columbia, Puerto Rico, the Northern Mariana Islands, American Samoa, the Virgin Islands, and Guam.
26 CFR 601.601: Rules and Regulations
(Also Part 1, §§ 25, 143, 6a.103A-1(b)(4), 6a.103A-2(f)(5)).
This notice sets forth updates on the corporate bond monthly yield curve, the corresponding spot segment rates for March 2021 used under § 417(e)(3)(D), the 24-month average segment rates applicable for March 2021, and the 30-year Treasury rates, as reflected by the application of § 430(h)(2)(C)(iv).
Nonacquiescence to the holding that an interest in a defined benefit pension plan is not an asset for purposes of applying the insolvency exclusion in I.R.C. § 108.
Announcement 2021-7 notifies taxpayers that amounts paid for personal protective equipment for the primary purpose of preventing the spread of the Coronavirus Disease 2019 are amounts treated as paid for medical care under § 213(d) of the Internal Revenue Code. As a result, these amounts are qualified medical expenses eligible to be paid or reimbursed without being included in gross income under health flexible spending arrangements (health FSAs), Archer medical savings accounts (Archer MSAs), health reimbursement arrangements (HRAs), or health savings accounts (HSAs). In addition, the announcement notifies administrators of group health plans regarding the ability to make certain plan amendments pursuant to the announcement.
Revenue Procedure 2021-18 provides an automatic procedure for a State or local government in which an empowerment zone is located to extend the empowerment zone designation made under section 1391(a) of the Internal Revenue Code (Code). Specifically, this revenue procedure provides that a State or local government that nominated an empowerment zone is deemed to extend until December 31, 2025, the termination date designated by that State or local government in its empowerment zone nomination (designated termination date), as described in section 1391(d)(1)(B). This revenue procedure further provides the procedure for such State or local government to decline this deemed extension of its designated termination date.
26 CFR 601.105: Examination of returns and claims for refund, credit, or abatement; determination of correct tax liability.
(Also Part I, § 1391.)
This revenue procedure provides guidance with respect to the United States and area median gross income figures for use by issuers of qualified mortgage bonds under § 143(a) of the Internal Revenue Code and issuers of mortgage credit certificates under § 25(c) (collectively, “issuers”) in computing the income requirements under § 143(f). This revenue procedure provides that issuers must use either (1) the income figures the Department of Housing and Urban Development (“HUD”) released most recently or (2) the income figures HUD released immediately prior to the income figures HUD released most recently, determined as of the date a mortgage loan or mortgage credit certificate is committed to a mortgagor. This revenue procedure also provides a 90-day transition period, following the release of the HUD income figures in a current calendar year, for issuers to use the income figures HUD released during the second calendar year prior to the current calendar year..
26 CFR 601.601: Rules and Regulations.
(Also Part I, §§ 25, 143)
Provide America’s taxpayers top-quality service by helping them understand and meet their tax responsibilities and enforce the law with integrity and fairness to all.
The Internal Revenue Bulletin is the authoritative instrument of the Commissioner of Internal Revenue for announcing official rulings and procedures of the Internal Revenue Service and for publishing Treasury Decisions, Executive Orders, Tax Conventions, legislation, court decisions, and other items of general interest. It is published weekly.
It is the policy of the Service to publish in the Bulletin all substantive rulings necessary to promote a uniform application of the tax laws, including all rulings that supersede, revoke, modify, or amend any of those previously published in the Bulletin. All published rulings apply retroactively unless otherwise indicated. Procedures relating solely to matters of internal management are not published; however, statements of internal practices and procedures that affect the rights and duties of taxpayers are published.
Revenue rulings represent the conclusions of the Service on the application of the law to the pivotal facts stated in the revenue ruling. In those based on positions taken in rulings to taxpayers or technical advice to Service field offices, identifying details and information of a confidential nature are deleted to prevent unwarranted invasions of privacy and to comply with statutory requirements.
Rulings and procedures reported in the Bulletin do not have the force and effect of Treasury Department Regulations, but they may be used as precedents. Unpublished rulings will not be relied on, used, or cited as precedents by Service personnel in the disposition of other cases. In applying published rulings and procedures, the effect of subsequent legislation, regulations, court decisions, rulings, and procedures must be considered, and Service personnel and others concerned are cautioned against reaching the same conclusions in other cases unless the facts and circumstances are substantially the same.
The Bulletin is divided into four parts as follows:
Part I.—1986 Code. This part includes rulings and decisions based on provisions of the Internal Revenue Code of 1986.
Part II.—Treaties and Tax Legislation. This part is divided into two subparts as follows: Subpart A, Tax Conventions and Other Related Items, and Subpart B, Legislation and Related Committee Reports.
Part III.—Administrative, Procedural, and Miscellaneous. To the extent practicable, pertinent cross references to these subjects are contained in the other Parts and Subparts. Also included in this part are Bank Secrecy Act Administrative Rulings. Bank Secrecy Act Administrative Rulings are issued by the Department of the Treasury’s Office of the Assistant Secretary (Enforcement).
Part IV.—Items of General Interest. This part includes notices of proposed rulemakings, disbarment and suspension lists, and announcements.
It is the policy of the Internal Revenue Service to announce at an early date whether it will follow the holdings in certain cases. An Action on Decision is the document making such an announcement. An Action on Decision will be issued at the discretion of the Service only on unappealed issues decided adverse to the government. Generally, an Action on Decision is issued where its guidance would be helpful to Service personnel working with the same or similar issues. Unlike a Treasury Regulation or a Revenue Ruling, an Action on Decision is not an affirmative statement of Service position. It is not intended to serve as public guidance and may not be cited as precedent.
Actions on Decisions shall be relied upon within the Service only as conclusions applying the law to the facts in the particular case at the time the Action on Decision was issued. Caution should be exercised in extending the recommendation of the Action on Decision to similar cases where the facts are different. Moreover, the recommendation in the Action on Decision may be superseded by new legislation, regulations, rulings, cases, or Actions on Decisions.
Prior to 1991, the Service published acquiescence or nonacquiescence only in certain regular Tax Court opinions. The Service has expanded its acquiescence program to include other civil tax cases where guidance is determined to be helpful. Accordingly, the Service now may acquiesce or nonacquiesce in the holdings of memorandum Tax Court opinions, as well as those of the United States District Courts, Claims Court, and Circuit Courts of Appeal. Regardless of the court deciding the case, the recommendation of any Action on Decision will be published in the Internal Revenue Bulletin.
The recommendation in every Action on Decision will be summarized as acquiescence, acquiescence in result only, or nonacquiescence. Both “acquiescence” and “acquiescence in result only” mean that the Service accepts the holding of the court in a case and that the Service will follow it in disposing of cases with the same controlling facts. However, “acquiescence” indicates neither approval nor disapproval of the reasons assigned by the court for its conclusions; whereas, “acquiescence in result only” indicates disagreement or concern with some or all of those reasons. “Nonacquiescence” signifies that, although no further review was sought, the Service does not agree with the holding of the court and, generally, will not follow the decision in disposing of cases involving other taxpayers. In reference to an opinion of a circuit court of appeals, a “nonacquiescence” indicates that the Service will not follow the holding on a nationwide basis. However, the Service will recognize the precedential impact of the opinion on cases arising within the venue of the deciding circuit.
The Commissioner does NOT ACQUIESCE in the following decision:
Schieber v. Commissioner, T.C. Memo. 2017-32, T.C. Docket No. 21690-14.1
1 Nonacquiescence to the holding that an interest in a defined benefit pension plan is not an asset for purposes of applying the insolvency exclusion in I.R.C. § 108.
On March 13, 2020, the President of the United States issued an emergency declaration under the Robert T. Stafford Disaster Relief and Emergency Assistance Act in response to the ongoing Coronavirus Disease 2019 (COVID-19) pandemic (Emergency Declaration). The Emergency Declaration instructed the Secretary of the Treasury “to provide relief from tax deadlines to Americans who have been adversely affected by the COVID-19 emergency, as appropriate, pursuant to 26 U.S.C. 7508A(a).” Pursuant to the Emergency Declaration, this notice provides relief under section 7508A of the Internal Revenue Code (Code) for the persons described in section III.A of this notice that the Secretary of the Treasury has determined to be affected by the COVID-19 emergency.
Section 7508A provides the Secretary of the Treasury or her delegate (Secretary) with authority to postpone the time for performing certain acts under the internal revenue laws for a taxpayer determined by the Secretary to be affected by a Federally declared disaster as defined in section 165(i)(5)(A) of the Code. Pursuant to section 7508A(a), a period of up to one year may be disregarded in determining whether the performance of certain acts is timely under the internal revenue laws.
The Secretary has determined that any person with a Federal income tax return filed on Form 1040, Form 1040-SR, Form 1040-NR, Form 1040-PR, Form 1040-SS, or Form 1040(SP) (Form 1040 series), or a Federal income tax payment reported on one of these forms, that absent this notice would be due April 15, 2021, is affected by the COVID-19 emergency for purposes of the relief described in this section III (Affected Taxpayer). In addition, persons who are required to file and furnish Form 5498, IRA Contribution Information, Form 5498-ESA, Coverdell ESA Contribution Information, and Form 5498-SA, HSA, Archer MSA, or Medicare Advantage MSA Information (Form 5498 series) that absent this notice would generally be due June 1, 2021, are Affected Taxpayers.
The Secretary has also determined that any individual with a period of limitations to file a claim for credit or refund of Federal income tax that absent this notice would expire on or after April 15, 2021, and before May 17, 2021 (for example, certain individual taxpayers with claims for credit or refund in respect of their 2017 taxable years), is an Affected Taxpayer.
For an Affected Taxpayer, the due date for filing Federal income tax returns in the Form 1040 series and making Federal income tax payments in connection with one of these forms having an original due date of April 15, 2021, is automatically postponed to May 17, 2021. Affected Taxpayers do not have to file any form, including Form 4868, Application for Automatic Extension of Time to File U.S. Individual Income Tax Return, to obtain this relief. This relief includes the filing of all schedules, returns, and other forms that are filed as attachments to the Form 1040 series or are required to be filed by the due date of the Form 1040 series, including, for example, Schedule H and Schedule SE, as well as Forms 965-A, 3520, 5329, 5471, 8621, 8858, 8865, 8915-E, and 8938. Finally, elections that are made or required to be made on a timely filed Form 1040 series (or attachment to such form) will be timely made if filed on such form or attachment, as appropriate, on or before May 17, 2021.
As a result of the postponement of the due date for Affected Taxpayers to file Federal income tax returns and make Federal income tax payments from April 15, 2021, to May 17, 2021, the period beginning on April 15, 2021, and ending on May 17, 2021, will be disregarded in the calculation of any interest, penalty, or addition to tax for failure to file the Federal income tax returns or to pay the Federal income taxes postponed by this notice. Interest, penalties, and additions to tax with respect to such postponed Federal income tax filings and payments will begin to accrue on May 18, 2021.
The postponement of the due date for filing these Federal income tax returns to May 17, 2021, also automatically postpones to the same date the time for Affected Taxpayers to make 2020 contributions to their individual retirement arrangements (IRAs and Roth IRAs), health savings accounts (HSAs), Archer Medical Savings Accounts (Archer MSAs), and Coverdell education savings accounts (Coverdell ESAs). This postponement also automatically postpones to May 17, 2021, the time for reporting and payment of the 10-percent additional tax on amounts includible in gross income from 2020 distributions from IRAs or workplace-based retirement plans.
Forms in the Form 5498 series must be filed with the IRS and furnished to participants and beneficiaries by the due date specified in General Instructions for Certain Information Returns (Forms 1096, 1097, 1098, 1099, 3921, 3922, 5498, and W-2G). Because filers of Form 5498 series are Affected Taxpayers, the due date for filing and furnishing the Form 5498 series is postponed to June 30, 2021. The period beginning on the original due date of those forms and ending on June 30, 2021, will be disregarded in the calculation of any penalty for failure to file those forms. Penalties with respect to such a postponed filing will begin to accrue on July 1, 2021.
The relief provided in this section III.B for filing Federal income tax returns and paying Federal income taxes is available solely with respect to the Form 1040 series returns having an original due date of April 15, 2021, in respect of an Affected Taxpayer’s 2020 taxable year, and the Form 5498 series returns that are due as described above. Businesses and any other type of taxpayer who file Federal income tax returns on forms outside of the Form 1040 series are not Affected Taxpayers for purposes of the relief described in this section III.B.
No extension is provided in this notice for the payment or deposit of any other type of Federal tax, including Federal estimated income tax payments, or for the filing of any Federal return other than the Form 1040 series and the Form 5498 series for the 2020 taxable year.
Individuals with a period of limitations to file a claim for credit or refund of Federal income tax expiring on or after April 15, 2021, and before May 17, 2021, have until May 17, 2021, to file those claims for credit or refund. This postponement is limited to claims for credit or refund properly filed on the Form 1040 series or on a Form 1040-X.
As a result of the postponement of the time for individuals to file claims for credit or refund of Federal income tax where the period to file that claim expires on or after April 15, 2021, and before May 17, 2021, the period beginning on April 15, 2021, and ending on May 17, 2021, will be disregarded in determining whether the filing of those claims is timely.
Revenue Procedure 2014-42, 2014-29 IRB 192, created a voluntary Annual Filing Season Program to encourage tax return preparers who do not have credentials as practitioners under Treasury Department Circular No. 230 (Regulations Governing Practice before the Internal Revenue Service) to complete continuing education courses for the purpose of increasing their knowledge of the law relevant to Federal tax returns. Tax return preparers who complete the requirements in Rev. Proc. 2014-42 receive an annual Record of Completion. Under Rev. Proc. 2014-42, applications to participate in the Annual Filing Season Program for the 2021 calendar year must be received by April 15, 2021. In light of the relief granted in section III of this notice, the 2021 calendar year application deadline is postponed to May 17, 2021.
This notice provides guidance on the corporate bond monthly yield curve, the corresponding spot segment rates used under § 417(e)(3), and the 24-month average segment rates under § 430(h)(2) of the Internal Revenue Code. In addition, this notice provides guidance as to the interest rate on 30-year Treasury securities under § 417(e)(3)(A)(ii)(II) as in effect for plan years beginning before 2008 and the 30-year Treasury weighted average rate under § 431(c)(6)(E)(ii)(I).
This notice does not provide 24-month average segment rates determined under § 430(h)(2)(C)(iv) of the Code reflecting the modifications made by § 9706(a) of the American Rescue Plan Act of 2021, Pub. L. No. 117-2 (ARPA), which was enacted on March 11, 2021. Those rates will be provided in future guidance.
Section 430 specifies the minimum funding requirements that apply to single-employer plans (except for CSEC plans under § 414(y)) pursuant to § 412. Section 430(h)(2) specifies the interest rates that must be used to determine a plan’s target normal cost and funding target. Under this provision, present value is generally determined using three 24-month average interest rates (“segment rates”), each of which applies to cash flows during specified periods. To the extent provided under § 430(h)(2)(C)(iv), these segment rates are adjusted by the applicable percentage of the 25-year average segment rates for the period ending September 30 of the year preceding the calendar year in which the plan year begins.1 However, an election may be made under § 430(h)(2)(D)(ii) to use the monthly yield curve in place of the segment rates.
Notice 2007-81, 2007-44 I.R.B. 899, provides guidelines for determining the monthly corporate bond yield curve, and the 24-month average corporate bond segment rates used to compute the target normal cost and the funding target. Consistent with the methodology specified in Notice 2007-81, the monthly corporate bond yield curve derived from February 2021 data is in Table 2021-2 at the end of this notice. The spot first, second, and third segment rates for the month of February 2021 are, respectively, 0.51, 2.54, and 3.45.
The 24-month average segment rates determined under § 430(h)(2)(C)(i) through (iii) must be adjusted pursuant to § 430(h)(2)(C)(iv) to be within the applicable minimum and maximum percentages of the corresponding 25-year average segment rates. The 25-year average segment rates for plan years beginning in 2020, and 2021 were published Notice 2019-51, 2019-41 I.R.B. 866, and Notice 2020-72, 2020-40 I.R.B. 789, respectively.
The three 24-month average corporate bond segment rates applicable for March 2021 without adjustment for the 25-year average segment rate limits are as follows:
25-YEAR AVERAGE SEGMENT RATES
Section 9706(a) of ARPA changes the 25-year average segment rates and the applicable minimum and maximum percentages used under § 430(h)(3)(C)(iv) of the Code to adjust the 24-month average segment rates. Prior to this change, the applicable minimum and maximum percentages were 90% and 110% for a plan year beginning in 2020, and 85% and 115% for a plan year beginning in 2021, respectively. After this change, the applicable minimum and maximum percentages are 95% and 105% for a plan year beginning in 2020 or 2021. In addition, pursuant to this change, any 25-year average segment rate that is less than 5% is deemed to be 5%.
Pursuant to § 9706(c)(1) of ARPA, these changes apply with respect to plan years beginning on or after January 1, 2020. However, § 9706(c)(2) of ARPA provides that a plan sponsor may elect not to have these changes apply to any plan year beginning before January 1, 2022.2
The rates set forth in this notice do not reflect the changes to § 430(h)(2)(C)(iv) of the Code made by § 9706(a) of ARPA. Accordingly, the adjusted 24-month average segment rates set forth in this notice apply only for plan years for which an election under § 9706(c)(2) of ARPA is in effect. For a plan year for which such an election applies, the 24-month averages applicable for March 2021, adjusted to be within the applicable minimum and maximum percentages of the corresponding 25-year average segment rates in accordance with § 430(h)(2)(C)(iv) of the Code, are as follows:
Section 431 specifies the minimum funding requirements that apply to multiemployer plans pursuant to § 412. Section 431(c)(6)(B) specifies a minimum amount for the full-funding limitation described in § 431(c)(6)(A), based on the plan’s current liability. Section 431(c)(6)(E)(ii)(I) provides that the interest rate used to calculate current liability for this purpose must be no more than 5 percent above and no more than 10 percent below the weighted average of the rates of interest on 30-year Treasury securities during the four-year period ending on the last day before the beginning of the plan year. Notice 88-73, 1988-2 C.B. 383, provides guidelines for determining the weighted average interest rate. The rate of interest on 30-year Treasury securities for February 2021 is 2.04 percent. The Service determined this rate as the average of the daily determinations of yield on the 30-year Treasury bond maturing in November 2050 determined each day through February 10, 2021, and the yield on the 30-year Treasury bond maturing in February 2051 determined each day for the balance of the month . For plan years beginning in March 2021, the weighted average of the rates of interest on 30-year Treasury securities and the permissible range of rates used to calculate current liability are as follows:
In general, the applicable interest rates under § 417(e)(3)(D) are segment rates computed without regard to a 24-month average. Notice 2007-81 provides guidelines for determining the minimum present value segment rates. Pursuant to that notice, the minimum present value segment rates determined for February 2021 are as follows:
The principal author of this notice is Tom Morgan of the Office of the Associate Chief Counsel (Employee Benefits, Exempt Organizations, and Employment Taxes). However, other personnel from the IRS participated in the development of this guidance. For further information regarding this notice, contact Mr. Morgan at 202-317-6700 or Paul Stern at 202-317-8702 (not toll-free numbers).
Table 2021-2 Monthly Yield Curve for February 2021 Derived from February 2021 Data
| Maturity | Yield | Maturity | Yield | Maturity | Yield | Maturity | Yield | Maturity | Yield |
|---|---|---|---|---|---|---|---|---|---|
| 0.5 | 0.18 | 20.5 | 3.22 | 40.5 | 3.48 | 60.5 | 3.58 | 80.5 | 3.63 |
| 1.0 | 0.23 | 21.0 | 3.23 | 41.0 | 3.49 | 61.0 | 3.58 | 81.0 | 3.63 |
| 1.5 | 0.28 | 21.5 | 3.24 | 41.5 | 3.49 | 61.5 | 3.58 | 81.5 | 3.63 |
| 2.0 | 0.35 | 22.0 | 3.25 | 42.0 | 3.49 | 62.0 | 3.58 | 82.0 | 3.63 |
| 2.5 | 0.42 | 22.5 | 3.26 | 42.5 | 3.50 | 62.5 | 3.58 | 82.5 | 3.63 |
| 3.0 | 0.51 | 23.0 | 3.27 | 43.0 | 3.50 | 63.0 | 3.59 | 83.0 | 3.63 |
| 3.5 | 0.61 | 23.5 | 3.28 | 43.5 | 3.50 | 63.5 | 3.59 | 83.5 | 3.63 |
| 4.0 | 0.72 | 24.0 | 3.29 | 44.0 | 3.50 | 64.0 | 3.59 | 84.0 | 3.63 |
| 4.5 | 0.85 | 24.5 | 3.30 | 44.5 | 3.51 | 64.5 | 3.59 | 84.5 | 3.63 |
| 5.0 | 0.98 | 25.0 | 3.31 | 45.0 | 3.51 | 65.0 | 3.59 | 85.0 | 3.63 |
| 5.5 | 1.12 | 25.5 | 3.31 | 45.5 | 3.51 | 65.5 | 3.59 | 85.5 | 3.64 |
| 6.0 | 1.26 | 26.0 | 3.32 | 46.0 | 3.52 | 66.0 | 3.59 | 86.0 | 3.64 |
| 6.5 | 1.41 | 26.5 | 3.33 | 46.5 | 3.52 | 66.5 | 3.60 | 86.5 | 3.64 |
| 7.0 | 1.56 | 27.0 | 3.34 | 47.0 | 3.52 | 67.0 | 3.60 | 87.0 | 3.64 |
| 7.5 | 1.70 | 27.5 | 3.34 | 47.5 | 3.52 | 67.5 | 3.60 | 87.5 | 3.64 |
| 8.0 | 1.84 | 28.0 | 3.35 | 48.0 | 3.53 | 68.0 | 3.60 | 88.0 | 3.64 |
| 8.5 | 1.97 | 28.5 | 3.36 | 48.5 | 3.53 | 68.5 | 3.60 | 88.5 | 3.64 |
| 9.0 | 2.09 | 29.0 | 3.37 | 49.0 | 3.53 | 69.0 | 3.60 | 89.0 | 3.64 |
| 9.5 | 2.21 | 29.5 | 3.37 | 49.5 | 3.53 | 69.5 | 3.60 | 89.5 | 3.64 |
| 10.0 | 2.32 | 30.0 | 3.38 | 50.0 | 3.54 | 70.0 | 3.60 | 90.0 | 3.64 |
| 10.5 | 2.42 | 30.5 | 3.39 | 50.5 | 3.54 | 70.5 | 3.61 | 90.5 | 3.64 |
| 11.0 | 2.51 | 31.0 | 3.39 | 51.0 | 3.54 | 71.0 | 3.61 | 91.0 | 3.64 |
| 11.5 | 2.60 | 31.5 | 3.40 | 51.5 | 3.54 | 71.5 | 3.61 | 91.5 | 3.64 |
| 12.0 | 2.67 | 32.0 | 3.40 | 52.0 | 3.55 | 72.0 | 3.61 | 92.0 | 3.65 |
| 12.5 | 2.74 | 32.5 | 3.41 | 52.5 | 3.55 | 72.5 | 3.61 | 92.5 | 3.65 |
| 13.0 | 2.80 | 33.0 | 3.42 | 53.0 | 3.55 | 73.0 | 3.61 | 93.0 | 3.65 |
| 13.5 | 2.86 | 33.5 | 3.42 | 53.5 | 3.55 | 73.5 | 3.61 | 93.5 | 3.65 |
| 14.0 | 2.90 | 34.0 | 3.43 | 54.0 | 3.55 | 74.0 | 3.61 | 94.0 | 3.65 |
| 14.5 | 2.95 | 34.5 | 3.43 | 54.5 | 3.56 | 74.5 | 3.61 | 94.5 | 3.65 |
| 15.0 | 2.99 | 35.0 | 3.44 | 55.0 | 3.56 | 75.0 | 3.62 | 95.0 | 3.65 |
| 15.5 | 3.02 | 35.5 | 3.44 | 55.5 | 3.56 | 75.5 | 3.62 | 95.5 | 3.65 |
| 16.0 | 3.05 | 36.0 | 3.45 | 56.0 | 3.56 | 76.0 | 3.62 | 96.0 | 3.65 |
| 16.5 | 3.08 | 36.5 | 3.45 | 56.5 | 3.56 | 76.5 | 3.62 | 96.5 | 3.65 |
| 17.0 | 3.10 | 37.0 | 3.45 | 57.0 | 3.57 | 77.0 | 3.62 | 97.0 | 3.65 |
| 17.5 | 3.12 | 37.5 | 3.46 | 57.5 | 3.57 | 77.5 | 3.62 | 97.5 | 3.65 |
| 18.0 | 3.14 | 38.0 | 3.46 | 58.0 | 3.57 | 78.0 | 3.62 | 98.0 | 3.65 |
| 18.5 | 3.16 | 38.5 | 3.47 | 58.5 | 3.57 | 78.5 | 3.62 | 98.5 | 3.65 |
| 19.0 | 3.18 | 39.0 | 3.47 | 59.0 | 3.57 | 79.0 | 3.62 | 99.0 | 3.65 |
| 19.5 | 3.19 | 39.5 | 3.47 | 59.5 | 3.57 | 79.5 | 3.62 | 99.5 | 3.65 |
| 20.0 | 3.20 | 40.0 | 3.48 | 60.0 | 3.58 | 80.0 | 3.63 | 100.0 | 3.66 |
1 Pursuant to § 433(h)(3)(A), the 3rd segment rate determined under § 430(h)(2)(C) is used to determine the current liability of a CSEC plan (which is used to calculate the minimum amount of the full funding limitation under § 433(c)(7)(C)).
2 This election may be made either for all purposes for which the amendments under § 9706 of ARPA apply or solely for purposes of determining the adjusted funding target attainment percentage under § 436 of the Code for the plan year.
This revenue procedure provides issuers of qualified mortgage bonds, as defined in § 143(a) of the Internal Revenue Code (Code), and issuers of mortgage credit certificates, as defined in § 25(c), with (1) the nationwide average purchase price for residences located in the United States, and (2) average area purchase price safe harbors for residences located in statistical areas in each state, the District of Columbia, Puerto Rico, the Northern Mariana Islands, American Samoa, the Virgin Islands, and Guam.
.01 Section 103(a) provides that, except as provided in § 103(b), gross income does not include interest on any State or local bond. Section 103(b)(1) provides that § 103(a) shall not apply to any private activity bond that is not a “qualified bond” within the meaning of § 141. Section 141(e) provides, in part, that the term “qualified bond” means any private activity bond if such bond (1) is a qualified mortgage bond under § 143, (2) meets the volume cap requirements under § 146, and (3) meets the applicable requirements under § 147.
.02 Section 143(a)(1) provides that the term “qualified mortgage bond” means a bond that is issued as part of a qualified mortgage issue. Section 143(a)(2)(A) provides that the term “qualified mortgage issue” means an issue of one or more bonds by a State or political subdivision thereof, but only if: (i) all proceeds of the issue (exclusive of issuance costs and a reasonably required reserve) are to be used to finance owner-occupied residences; (ii) the issue meets the requirements of subsections (c), (d), (e), (f), (g), (h), (i), and (m)(7) of § 143; (iii) the issue does not meet the private business tests of paragraphs (1) and (2) of § 141(b); and (iv) with respect to amounts received more than 10 years after the date of issuance, repayments of $250,000 or more of principal on mortgage financing provided by the issue are used by the close of the first semiannual period beginning after the date the prepayment (or complete repayment) is received to redeem bonds that are part of the issue.
.03 Section 143(e)(1) provides that an issue of bonds meets the purchase price requirements of § 143(e) if the acquisition cost of each residence financed by the issue does not exceed 90 percent of the average area purchase price applicable to such residence. Section 143(e)(5) provides that, in the case of a targeted area residence (as defined in § 143(j)), § 143(e)(1) shall be applied by substituting 110 percent for 90 percent.
.04 Section 143(e)(2) provides that the term “average area purchase price” means, with respect to any residence, the average purchase price of single-family residences (in the statistical area in which the residence is located) that were purchased during the most recent 12-month period for which sufficient statistical information is available. Under §§ 143(e)(3) and (4), respectively, separate determinations of average area purchase price are to be made for new and existing residences, and for two-, three-, and four-family residences.
.05 Section 143(e)(2) also provides that the determination of the average area purchase price shall be made as of the date on which the commitment to provide the financing is made or, if earlier, the date of the purchase of the residence.
.06 Section 143(k)(2)(A) provides that the term “statistical area” means (i) a metropolitan statistical area (MSA), and (ii) any county (or the portion thereof) that is not within an MSA. Section 143(k)(2)(C) further provides that if sufficient recent statistical information with respect to a county (or portion thereof) is unavailable, the Secretary may substitute another area for which there is sufficient recent statistical information for such county (or portion thereof). In the case of any portion of a State which is not within a county, § 143(k)(2)(D) provides that the Secretary may designate an area that is the equivalent of a county. Section 6a.103A-1(b)(4)(i) of the Income Tax Regulations (issued under § 103A of the Internal Revenue Code of 1954, the predecessor of § 143 of the Code) provides that the term “State” includes a possession of the United States and the District of Columbia.
.07 Section 6a.103A-2(f)(5)(i) provides that an issuer may rely upon the average area purchase price safe harbors published by the Department of the Treasury (Treasury Department) for the statistical area in which a residence is located. Section 6a.103A-2(f)(5)(i) further provides that an issuer may use an average area purchase price limitation different from the published safe harbor if the issuer has more accurate and comprehensive data for the statistical area.
.08 Section 25(c) permits a State or political subdivision thereof to establish a qualified mortgage credit certificate program. In general, a qualified mortgage credit certificate program is a program under which the issuing authority elects not to issue an amount of private activity bonds that it may otherwise issue during the calendar year under § 146, and in its place, issues mortgage credit certificates to taxpayers in connection with the acquisition of their principal residences. Section 25(a)(1) provides, in general, that the holder of a mortgage credit certificate may claim a federal income tax credit equal to the product of the credit rate specified in the certificate and the interest paid or accrued during the tax year on the remaining principal of the indebtedness incurred to acquire the residence. Section 25(c)(2)(A)(iii)(III) generally provides that residences acquired in connection with the issuance of mortgage credit certificates must meet the purchase price requirements of § 143(e).
.09 Section 143(f) imposes limitations on the income of mortgagors for whom financing may be provided by qualified mortgage bonds. In addition, § 25(c)(2)(A)(iii)(IV) provides that holders of mortgage credit certificates must meet the income requirement of § 143(f). Generally, under §§ 143(f)(1) and 25(c)(2)(A)(iii)(IV), the income requirement is met only if all owner-financing under a qualified mortgage bond and all mortgage credit certificates issued under a qualified mortgage credit certificate program are provided to mortgagors whose family income is 115 percent or less of the applicable median family income. Section 143(f)(5), however, generally provides for an upward adjustment to the percentage limitation in high housing cost areas. High housing cost areas are defined in § 143(f)(5)(C) as any statistical area for which the housing cost/income ratio is greater than 1.2.
.10 Under § 143(f)(5)(D), the housing cost/income ratio with respect to any statistical area is determined by dividing (a) the applicable housing price ratio for such area by (b) the ratio that the area median gross income for such area bears to the median gross income for the United States. The applicable housing price ratio is the new housing price ratio (new housing average area purchase price divided by the new housing average purchase price for the United States) or the existing housing price ratio (existing housing average area purchase price divided by the existing housing average purchase price for the United States), whichever results in the housing cost/income ratio being closer to 1.
.11 Average area purchase price safe harbors for each state, the District of Columbia, Puerto Rico, the Northern Mariana Islands, American Samoa, the Virgin Islands, and Guam were last published in Rev. Proc. 2020-18, I.R.B. 2020-15, 592.
.12 The nationwide average purchase price limitation was last published in section 4.02 of Rev. Proc. 2020-18. Guidance with respect to the United States and area median gross income figures that are used in computing the housing cost/income ratio described in § 143(f)(5) was published in Rev. Proc. 2021-19, I.R.B. 2021-15 (released on March 25, 2021).
.13 This revenue procedure uses Federal Housing Administration (FHA) loan limits for a given statistical area to calculate the average area purchase price safe harbor for that area. FHA sets limits on the dollar value of loans it will insure based on median home prices and conforming loan limits established by the Federal Home Loan Mortgage Corporation. In particular, FHA sets an area’s loan limit at 95 percent of the median home sales price for the area, subject to certain floors and caps measured against conforming loan limits.
.14 To calculate the average area purchase price safe harbors in this revenue procedure, the FHA loan limits are adjusted to take into account the differences between average and median purchase prices. Because FHA loan limits do not differentiate between new and existing residences, this revenue procedure contains a single average area purchase price safe harbor for both new and existing residences in a statistical area. The Treasury Department and the Internal Revenue Service (IRS) have determined that FHA loan limits provide a reasonable basis for determining average area purchase price safe harbors. If the Treasury Department and the IRS become aware of other sources of average purchase price data, including data that differentiate between new and existing residences, consideration will be given as to whether such data provide a more accurate method for calculating average area purchase price safe harbors.
.15 The average area purchase price safe harbors listed in section 4.01 of this revenue procedure are based on FHA loan limits released December 2, 2020. FHA loan limits are available for statistical areas in each state, the District of Columbia, Puerto Rico, the Northern Mariana Islands, American Samoa, the Virgin Islands, and Guam. See section 3.03 of this revenue procedure with respect to FHA loan limits revised after December 2, 2020.
.16 OMB Bulletin No. 03-04, dated and effective June 6, 2003, revised the definitions of the nation’s metropolitan areas and recognized 49 new metropolitan statistical areas. The OMB bulletin no longer includes primary metropolitan statistical areas.
.01 Average area purchase price safe harbors for statistical areas in each state, the District of Columbia, Puerto Rico, the Northern Mariana Islands, American Samoa, the Virgin Islands, and Guam are set forth in section 4.01 of this revenue procedure. Average area purchase price safe harbors are provided for single-family and two to four-family residences. For each type of residence, section 4.01 of this revenue procedure contains a single safe harbor that may be used for both new and existing residences. Issuers of qualified mortgage bonds and issuers of mortgage credit certificates may rely on these safe harbors to satisfy the requirements of §§ 143(e) and (f). Section 4.01 of this revenue procedure provides safe harbors for MSAs and for certain counties and county equivalents. If no purchase price safe harbor is available for a statistical area, the safe harbor for “ALL OTHER AREAS” may be used for that statistical area.
.02 If a residence is in an MSA, the safe harbor applicable to it is the limitation of that MSA. If an MSA falls in more than one state, the MSA is listed in section 4.01 of this revenue procedure under each state.
.03 If the FHA revises the FHA loan limit for any statistical area after December 2, 2020, an issuer of qualified mortgage bonds or mortgage credit certificates may use the revised FHA loan limit for that statistical area to compute (as provided in the next sentence) a revised average area purchase price safe harbor for the statistical area provided that the issuer maintains records evidencing the revised FHA loan limit. The revised average area purchase price safe harbor for that statistical area is computed by dividing the revised FHA loan limit by 1.03.
.04 If, pursuant to § 6a.103A-2(f)(5)(i), an issuer uses more accurate and comprehensive data to determine the average area purchase price for a statistical area, the issuer must make separate average area purchase price determinations for new and existing residences. Moreover, when computing the average area purchase price for a statistical area that is an MSA, as defined in OMB Bulletin No. 03-04, the issuer must make the computation for the entire applicable MSA. When computing the average area purchase price for a statistical area that is not an MSA, the issuer must make the computation for the entire statistical area and may not combine statistical areas. Thus, for example, the issuer may not combine two or more counties.
.05 If an issuer receives a ruling permitting it to rely on an average area purchase price limitation that is higher than the applicable safe harbor in this revenue procedure, the issuer may rely on that higher limitation for the purpose of satisfying the requirements of §§ 143(e) and (f) for bonds sold, and mortgage credit certificates issued, not more than 30 months following the termination date of the 12-month period used by the issuer to compute the limitation.
.06 Section 4.02 of this revenue procedure sets forth a single nationwide average purchase price for purposes of computing the housing cost/income ratio under § 143(f)(5).
.07 Issuers must use the nationwide average purchase price set forth in section 4.02 of this revenue procedure when computing the housing cost/income ratio under § 143(f)(5) regardless of whether they are relying on the average area purchase price safe harbors contained in this revenue procedure or using more accurate and comprehensive data to determine average area purchase prices for new and existing residences for a statistical area that are different from the published safe harbors in this revenue procedure.
.08 If, pursuant to section 6.02 of this revenue procedure, an issuer relies on the average area purchase price safe harbors contained in Rev. Proc. 2020-18, the issuer must use the nationwide average purchase price set forth in section 4.02 of Rev. Proc. 2020-18 in computing the housing cost/income ratio under § 143(f)(5). Likewise, if, pursuant to section 6.04 of this revenue procedure, an issuer relies on the nationwide average purchase price published in Rev. Proc. 2020-18, the issuer must use the average area purchase price safe harbors set forth in section 4.01 of Rev. Proc. 2020-18 in computing the housing cost/income ratio under § 143(f)(5).
.01 Average area purchase prices for single-family and two to four-family residences in MSAs, and for certain counties and county equivalents are set forth below. The safe harbor for “ALL OTHER AREAS” (found at the end of the table below) may be used for a statistical area that is not listed below.
2021 Average Area Purchase Prices for Mortgage Revenue Bonds
| County Name | State | One-Unit Limit | Two-Unit Limit | Three-Unit Limit | Four-Unit Limit |
|---|---|---|---|---|---|
| ALEUTIANS WEST | AK | $530,235 | $678,770 | $820,497 | $1,019,712 |
| ANCHORAGE MUNIC | AK | $406,066 | $519,826 | $628,334 | $780,907 |
| JUNEAU CITY AND | AK | $469,828 | $601,438 | $727,018 | $903,519 |
| KETCHIKAN GATEW | AK | $395,998 | $506,938 | $612,771 | $761,550 |
| KODIAK ISLAND B | AK | $406,066 | $519,826 | $628,334 | $780,907 |
| MATANUSKA-SUSIT | AK | $406,066 | $519,826 | $628,334 | $780,907 |
| NOME CENSUS ARE | AK | $428,438 | $548,473 | $662,963 | $823,901 |
| SITKA CITY AND | AK | $473,184 | $605,767 | $732,222 | $909,988 |
| SKAGWAY MUNICIP | AK | $403,828 | $516,957 | $624,881 | $776,578 |
| YAKUTAT CITY AN | AK | $409,422 | $524,106 | $633,538 | $787,375 |
| COCONINO | AZ | $379,218 | $485,440 | $586,799 | $729,255 |
| MARICOPA | AZ | $357,964 | $458,253 | $553,921 | $688,400 |
| PINAL | AZ | $357,964 | $458,253 | $553,921 | $688,400 |
| ALAMEDA | CA | $799,948 | $1,024,284 | $1,238,041 | $1,538,614 |
| ALPINE | CA | $450,811 | $577,120 | $697,593 | $866,945 |
| AMADOR | CA | $354,608 | $453,973 | $548,716 | $681,932 |
| CALAVERAS | CA | $363,557 | $465,402 | $562,578 | $699,149 |
| CONTRA COSTA | CA | $799,948 | $1,024,284 | $1,238,041 | $1,538,614 |
| EL DORADO | CA | $581,692 | $744,673 | $900,115 | $1,118,638 |
| HUMBOLDT | CA | $346,778 | $443,905 | $536,606 | $666,854 |
| INYO | CA | $363,557 | $465,402 | $562,578 | $699,149 |
| LOS ANGELES | CA | $799,948 | $1,024,284 | $1,238,041 | $1,538,614 |
| MARIN | CA | $799,948 | $1,024,284 | $1,238,041 | $1,538,614 |
| MENDOCINO | CA | $430,676 | $551,343 | $666,417 | $828,230 |
| MONO | CA | $514,574 | $658,732 | $796,276 | $989,557 |
| MONTEREY | CA | $719,284 | $920,834 | $1,113,045 | $1,383,269 |
| NAPA | CA | $794,233 | $1,016,745 | $1,229,043 | $1,527,379 |
| NEVADA | CA | $512,336 | $655,863 | $792,823 | $985,277 |
| ORANGE | CA | $799,948 | $1,024,284 | $1,238,041 | $1,538,614 |
| PLACER | CA | $581,692 | $744,673 | $900,115 | $1,118,638 |
| RIVERSIDE | CA | $464,235 | $594,289 | $718,360 | $892,771 |
| SACRAMENTO | CA | $581,692 | $744,673 | $900,115 | $1,118,638 |
| SAN BENITO | CA | $799,948 | $1,024,284 | $1,238,041 | $1,538,614 |
| SAN BERNARDINO | CA | $464,235 | $594,289 | $718,360 | $892,771 |
| SAN DIEGO | CA | $732,708 | $938,003 | $1,133,813 | $1,409,095 |
| SAN FRANCISCO | CA | $799,948 | $1,024,284 | $1,238,041 | $1,538,614 |
| SAN JOAQUIN | CA | $469,828 | $601,438 | $727,018 | $903,519 |
| SAN LUIS OBISPO | CA | $682,369 | $873,559 | $1,055,946 | $1,312,260 |
| SAN MATEO | CA | $799,948 | $1,024,284 | $1,238,041 | $1,538,614 |
| SANTA BARBARA | CA | $642,098 | $822,005 | $993,594 | $1,234,831 |
| SANTA CLARA | CA | $799,948 | $1,024,284 | $1,238,041 | $1,538,614 |
| SANTA CRUZ | CA | $799,948 | $1,024,284 | $1,238,041 | $1,538,614 |
| SOLANO | CA | $535,828 | $685,968 | $829,154 | $1,030,460 |
| SONOMA | CA | $687,963 | $880,709 | $1,064,603 | $1,323,009 |
| STANISLAUS | CA | $385,930 | $494,049 | $597,207 | $742,192 |
| SUTTER | CA | $363,557 | $465,402 | $562,578 | $699,149 |
| VENTURA | CA | $719,284 | $920,834 | $1,113,045 | $1,383,269 |
| YOLO | CA | $581,692 | $744,673 | $900,115 | $1,118,638 |
| YUBA | CA | $363,557 | $465,402 | $562,578 | $699,149 |
| ADAMS | CO | $580,573 | $743,214 | $898,413 | $1,116,498 |
| ARAPAHOE | CO | $580,573 | $743,214 | $898,413 | $1,116,498 |
| BOULDER | CO | $636,505 | $814,855 | $984,937 | $1,224,082 |
| BROOMFIELD | CO | $580,573 | $743,214 | $898,413 | $1,116,498 |
| CHAFFEE | CO | $380,337 | $486,900 | $588,550 | $731,395 |
| CLEAR CREEK | CO | $580,573 | $743,214 | $898,413 | $1,116,498 |
| DENVER | CO | $580,573 | $743,214 | $898,413 | $1,116,498 |
| DOUGLAS | CO | $580,573 | $743,214 | $898,413 | $1,116,498 |
| EAGLE | CO | $799,826 | $1,023,943 | $1,237,700 | $1,538,176 |
| EL PASO | CO | $382,574 | $489,769 | $592,003 | $735,724 |
| ELBERT | CO | $580,573 | $743,214 | $898,413 | $1,116,498 |
| GARFIELD | CO | $799,948 | $1,024,284 | $1,238,041 | $1,538,614 |
| GILPIN | CO | $580,573 | $743,214 | $898,413 | $1,116,498 |
| GRAND | CO | $514,574 | $658,732 | $796,276 | $989,557 |
| GUNNISON | CO | $397,117 | $508,348 | $614,522 | $763,690 |
| HINSDALE | CO | $416,133 | $532,715 | $643,947 | $800,264 |
| JEFFERSON | CO | $580,573 | $743,214 | $898,413 | $1,116,498 |
| LA PLATA | CO | $436,269 | $558,492 | $675,074 | $838,979 |
| LARIMER | CO | $451,930 | $578,531 | $699,344 | $869,085 |
| MONTROSE | CO | $413,896 | $529,845 | $640,493 | $795,936 |
| OURAY | CO | $413,896 | $529,845 | $640,493 | $795,936 |
| PARK | CO | $580,573 | $743,214 | $898,413 | $1,116,498 |
| PITKIN | CO | $799,948 | $1,024,284 | $1,238,041 | $1,538,614 |
| ROUTT | CO | $659,997 | $844,912 | $1,021,317 | $1,269,265 |
| SAN MIGUEL | CO | $799,948 | $1,024,284 | $1,238,041 | $1,538,614 |
| SUMMIT | CO | $799,948 | $1,024,284 | $1,238,041 | $1,538,614 |
| TELLER | CO | $382,574 | $489,769 | $592,003 | $735,724 |
| WELD | CO | $417,252 | $534,125 | $645,649 | $802,404 |
| FAIRFIELD | CT | $585,048 | $748,953 | $905,319 | $1,125,107 |
| LITCHFIELD | CT | $347,897 | $445,364 | $538,357 | $669,043 |
| WINDHAM | CT | $354,608 | $453,973 | $548,716 | $681,932 |
| DISTRICT OF COL | DC | $799,948 | $1,024,284 | $1,238,041 | $1,538,614 |
| NEW CASTLE | DE | $419,489 | $536,995 | $649,151 | $806,733 |
| BAKER | FL | $378,100 | $484,030 | $585,096 | $727,115 |
| BROWARD | FL | $391,523 | $501,199 | $605,864 | $752,941 |
| CLAY | FL | $378,100 | $484,030 | $585,096 | $727,115 |
| COLLIER | FL | $447,455 | $572,791 | $692,389 | $860,476 |
| DUVAL | FL | $378,100 | $484,030 | $585,096 | $727,115 |
| MARTIN | FL | $371,388 | $475,421 | $574,688 | $714,226 |
| MIAMI-DADE | FL | $391,523 | $501,199 | $605,864 | $752,941 |
| MONROE | FL | $591,760 | $757,561 | $915,727 | $1,137,996 |
| NASSAU | FL | $378,100 | $484,030 | $585,096 | $727,115 |
| OKALOOSA | FL | $429,557 | $549,884 | $664,714 | $826,090 |
| PALM BEACH | FL | $391,523 | $501,199 | $605,864 | $752,941 |
| ST. JOHNS | FL | $378,100 | $484,030 | $585,096 | $727,115 |
| ST. LUCIE | FL | $371,388 | $475,421 | $574,688 | $714,226 |
| WALTON | FL | $429,557 | $549,884 | $664,714 | $826,090 |
| BARROW | GA | $401,591 | $514,087 | $621,428 | $772,298 |
| BARTOW | GA | $401,591 | $514,087 | $621,428 | $772,298 |
| BUTTS | GA | $401,591 | $514,087 | $621,428 | $772,298 |
| CARROLL | GA | $401,591 | $514,087 | $621,428 | $772,298 |
| CHEROKEE | GA | $401,591 | $514,087 | $621,428 | $772,298 |
| CLARKE | GA | $380,337 | $486,900 | $588,550 | $731,395 |
| CLAYTON | GA | $401,591 | $514,087 | $621,428 | $772,298 |
| COBB | GA | $401,591 | $514,087 | $621,428 | $772,298 |
| COWETA | GA | $401,591 | $514,087 | $621,428 | $772,298 |
| DAWSON | GA | $401,591 | $514,087 | $621,428 | $772,298 |
| DEKALB | GA | $401,591 | $514,087 | $621,428 | $772,298 |
| DOUGLAS | GA | $401,591 | $514,087 | $621,428 | $772,298 |
| FAYETTE | GA | $401,591 | $514,087 | $621,428 | $772,298 |
| FORSYTH | GA | $401,591 | $514,087 | $621,428 | $772,298 |
| FULTON | GA | $401,591 | $514,087 | $621,428 | $772,298 |
| GREENE | GA | $501,150 | $641,563 | $775,508 | $963,780 |
| GWINNETT | GA | $401,591 | $514,087 | $621,428 | $772,298 |
| HARALSON | GA | $401,591 | $514,087 | $621,428 | $772,298 |
| HEARD | GA | $401,591 | $514,087 | $621,428 | $772,298 |
| HENRY | GA | $401,591 | $514,087 | $621,428 | $772,298 |
| JASPER | GA | $401,591 | $514,087 | $621,428 | $772,298 |
| LAMAR | GA | $401,591 | $514,087 | $621,428 | $772,298 |
| MADISON | GA | $380,337 | $486,900 | $588,550 | $731,395 |
| MERIWETHER | GA | $401,591 | $514,087 | $621,428 | $772,298 |
| MORGAN | GA | $401,591 | $514,087 | $621,428 | $772,298 |
| NEWTON | GA | $401,591 | $514,087 | $621,428 | $772,298 |
| OCONEE | GA | $380,337 | $486,900 | $588,550 | $731,395 |
| OGLETHORPE | GA | $380,337 | $486,900 | $588,550 | $731,395 |
| PAULDING | GA | $401,591 | $514,087 | $621,428 | $772,298 |
| PICKENS | GA | $401,591 | $514,087 | $621,428 | $772,298 |
| PIKE | GA | $401,591 | $514,087 | $621,428 | $772,298 |
| ROCKDALE | GA | $401,591 | $514,087 | $621,428 | $772,298 |
| SPALDING | GA | $401,591 | $514,087 | $621,428 | $772,298 |
| WALTON | GA | $401,591 | $514,087 | $621,428 | $772,298 |
| HAWAII | HI | $397,117 | $508,348 | $614,522 | $763,690 |
| HONOLULU | HI | $701,386 | $897,878 | $1,085,371 | $1,348,835 |
| KALAWAO | HI | $703,624 | $900,747 | $1,088,824 | $1,353,163 |
| KAUAI | HI | $700,268 | $896,467 | $1,083,620 | $1,346,695 |
| MAUI | HI | $703,624 | $900,747 | $1,088,824 | $1,353,163 |
| ADA | ID | $403,828 | $516,957 | $624,881 | $776,578 |
| BLAINE | ID | $628,675 | $804,836 | $972,826 | $1,209,005 |
| BOISE | ID | $403,828 | $516,957 | $624,881 | $776,578 |
| CAMAS | ID | $628,675 | $804,836 | $972,826 | $1,209,005 |
| CANYON | ID | $403,828 | $516,957 | $624,881 | $776,578 |
| GEM | ID | $403,828 | $516,957 | $624,881 | $776,578 |
| KOOTENAI | ID | $378,100 | $484,030 | $585,096 | $727,115 |
| OWYHEE | ID | $403,828 | $516,957 | $624,881 | $776,578 |
| TETON | ID | $799,948 | $1,024,284 | $1,238,041 | $1,538,614 |
| VALLEY | ID | $369,151 | $472,552 | $571,235 | $709,898 |
| COOK | IL | $369,151 | $472,552 | $571,235 | $709,898 |
| DEKALB | IL | $369,151 | $472,552 | $571,235 | $709,898 |
| DUPAGE | IL | $369,151 | $472,552 | $571,235 | $709,898 |
| GRUNDY | IL | $369,151 | $472,552 | $571,235 | $709,898 |
| KANE | IL | $369,151 | $472,552 | $571,235 | $709,898 |
| KENDALL | IL | $369,151 | $472,552 | $571,235 | $709,898 |
| LAKE | IL | $369,151 | $472,552 | $571,235 | $709,898 |
| MCHENRY | IL | $369,151 | $472,552 | $571,235 | $709,898 |
| WILL | IL | $369,151 | $472,552 | $571,235 | $709,898 |
| BOONE | IN | $369,151 | $472,552 | $571,235 | $709,898 |
| BROWN | IN | $369,151 | $472,552 | $571,235 | $709,898 |
| HAMILTON | IN | $369,151 | $472,552 | $571,235 | $709,898 |
| HANCOCK | IN | $369,151 | $472,552 | $571,235 | $709,898 |
| HENDRICKS | IN | $369,151 | $472,552 | $571,235 | $709,898 |
| JASPER | IN | $369,151 | $472,552 | $571,235 | $709,898 |
| JOHNSON | IN | $369,151 | $472,552 | $571,235 | $709,898 |
| LAKE | IN | $369,151 | $472,552 | $571,235 | $709,898 |
| MADISON | IN | $369,151 | $472,552 | $571,235 | $709,898 |
| MARION | IN | $369,151 | $472,552 | $571,235 | $709,898 |
| MORGAN | IN | $369,151 | $472,552 | $571,235 | $709,898 |
| NEWTON | IN | $369,151 | $472,552 | $571,235 | $709,898 |
| PORTER | IN | $369,151 | $472,552 | $571,235 | $709,898 |
| PUTNAM | IN | $369,151 | $472,552 | $571,235 | $709,898 |
| SHELBY | IN | $369,151 | $472,552 | $571,235 | $709,898 |
| JOHNSON | KS | $379,218 | $485,440 | $586,799 | $729,255 |
| LEAVENWORTH | KS | $379,218 | $485,440 | $586,799 | $729,255 |
| LINN | KS | $379,218 | $485,440 | $586,799 | $729,255 |
| MIAMI | KS | $379,218 | $485,440 | $586,799 | $729,255 |
| WYANDOTTE | KS | $379,218 | $485,440 | $586,799 | $729,255 |
| BARNSTABLE | MA | $492,201 | $630,085 | $761,647 | $946,563 |
| BRISTOL | MA | $492,201 | $630,085 | $761,647 | $946,563 |
| DUKES | MA | $799,948 | $1,024,284 | $1,238,041 | $1,538,614 |
| ESSEX | MA | $704,742 | $902,206 | $1,090,575 | $1,355,303 |
| MIDDLESEX | MA | $704,742 | $902,206 | $1,090,575 | $1,355,303 |
| NANTUCKET | MA | $799,948 | $1,024,284 | $1,238,041 | $1,538,614 |
| NORFOLK | MA | $704,742 | $902,206 | $1,090,575 | $1,355,303 |
| PLYMOUTH | MA | $704,742 | $902,206 | $1,090,575 | $1,355,303 |
| SUFFOLK | MA | $704,742 | $902,206 | $1,090,575 | $1,355,303 |
| WORCESTER | MA | $354,608 | $453,973 | $548,716 | $681,932 |
| ANNE ARUNDEL | MD | $523,523 | $670,210 | $810,137 | $1,006,775 |
| BALTIMORE | MD | $523,523 | $670,210 | $810,137 | $1,006,775 |
| BALTIMORE CITY | MD | $523,523 | $670,210 | $810,137 | $1,006,775 |
| CALVERT | MD | $799,948 | $1,024,284 | $1,238,041 | $1,538,614 |
| CARROLL | MD | $523,523 | $670,210 | $810,137 | $1,006,775 |
| CECIL | MD | $419,489 | $536,995 | $649,151 | $806,733 |
| CHARLES | MD | $799,948 | $1,024,284 | $1,238,041 | $1,538,614 |
| FREDERICK | MD | $799,948 | $1,024,284 | $1,238,041 | $1,538,614 |
| HARFORD | MD | $523,523 | $670,210 | $810,137 | $1,006,775 |
| HOWARD | MD | $523,523 | $670,210 | $810,137 | $1,006,775 |
| MONTGOMERY | MD | $799,948 | $1,024,284 | $1,238,041 | $1,538,614 |
| PRINCE GEORGE’S | MD | $799,948 | $1,024,284 | $1,238,041 | $1,538,614 |
| QUEEN ANNE’S | MD | $523,523 | $670,210 | $810,137 | $1,006,775 |
| TALBOT | MD | $397,117 | $508,348 | $614,522 | $763,690 |
| CUMBERLAND | ME | $392,642 | $502,658 | $607,567 | $755,081 |
| SAGADAHOC | ME | $392,642 | $502,658 | $607,567 | $755,081 |
| YORK | ME | $392,642 | $502,658 | $607,567 | $755,081 |
| ANOKA | MN | $391,523 | $501,199 | $605,864 | $752,941 |
| CARVER | MN | $391,523 | $501,199 | $605,864 | $752,941 |
| CHISAGO | MN | $391,523 | $501,199 | $605,864 | $752,941 |
| DAKOTA | MN | $391,523 | $501,199 | $605,864 | $752,941 |
| HENNEPIN | MN | $391,523 | $501,199 | $605,864 | $752,941 |
| ISANTI | MN | $391,523 | $501,199 | $605,864 | $752,941 |
| LE SUEUR | MN | $391,523 | $501,199 | $605,864 | $752,941 |
| MILLE LACS | MN | $391,523 | $501,199 | $605,864 | $752,941 |
| RAMSEY | MN | $391,523 | $501,199 | $605,864 | $752,941 |
| SCOTT | MN | $391,523 | $501,199 | $605,864 | $752,941 |
| SHERBURNE | MN | $391,523 | $501,199 | $605,864 | $752,941 |
| WASHINGTON | MN | $391,523 | $501,199 | $605,864 | $752,941 |
| WRIGHT | MN | $391,523 | $501,199 | $605,864 | $752,941 |
| BATES | MO | $379,218 | $485,440 | $586,799 | $729,255 |
| CALDWELL | MO | $379,218 | $485,440 | $586,799 | $729,255 |
| CASS | MO | $379,218 | $485,440 | $586,799 | $729,255 |
| CLAY | MO | $379,218 | $485,440 | $586,799 | $729,255 |
| CLINTON | MO | $379,218 | $485,440 | $586,799 | $729,255 |
| JACKSON | MO | $379,218 | $485,440 | $586,799 | $729,255 |
| LAFAYETTE | MO | $379,218 | $485,440 | $586,799 | $729,255 |
| PLATTE | MO | $379,218 | $485,440 | $586,799 | $729,255 |
| RAY | MO | $379,218 | $485,440 | $586,799 | $729,255 |
| FLATHEAD | MT | $368,032 | $471,141 | $569,484 | $707,758 |
| GALLATIN | MT | $465,354 | $595,748 | $720,111 | $894,911 |
| MISSOULA | MT | $378,100 | $484,030 | $585,096 | $727,115 |
| PARK | MT | $366,913 | $469,682 | $567,782 | $705,618 |
| RICHLAND | MT | $346,778 | $443,905 | $536,606 | $666,854 |
| CAMDEN | NC | $446,337 | $571,381 | $690,686 | $858,336 |
| CHATHAM | NC | $425,083 | $544,193 | $657,759 | $817,481 |
| CURRITUCK | NC | $446,337 | $571,381 | $690,686 | $858,336 |
| DARE | NC | $385,930 | $494,049 | $597,207 | $742,192 |
| DURHAM | NC | $425,083 | $544,193 | $657,759 | $817,481 |
| FRANKLIN | NC | $361,320 | $462,533 | $559,125 | $694,869 |
| GATES | NC | $446,337 | $571,381 | $690,686 | $858,336 |
| GRANVILLE | NC | $425,083 | $544,193 | $657,759 | $817,481 |
| HYDE | NC | $469,828 | $601,438 | $727,018 | $903,519 |
| JOHNSTON | NC | $361,320 | $462,533 | $559,125 | $694,869 |
| ORANGE | NC | $425,083 | $544,193 | $657,759 | $817,481 |
| PASQUOTANK | NC | $783,047 | $1,002,446 | $1,211,729 | $1,505,882 |
| PERQUIMANS | NC | $783,047 | $1,002,446 | $1,211,729 | $1,505,882 |
| PERSON | NC | $425,083 | $544,193 | $657,759 | $817,481 |
| WAKE | NC | $361,320 | $462,533 | $559,125 | $694,869 |
| LINCOLN | NE | $421,727 | $539,865 | $652,604 | $811,013 |
| LOGAN | NE | $421,727 | $539,865 | $652,604 | $811,013 |
| MCPHERSON | NE | $421,727 | $539,865 | $652,604 | $811,013 |
| HILLSBOROUGH | NH | $363,557 | $465,402 | $562,578 | $699,149 |
| ROCKINGHAM | NH | $704,742 | $902,206 | $1,090,575 | $1,355,303 |
| STRAFFORD | NH | $704,742 | $902,206 | $1,090,575 | $1,355,303 |
| BERGEN | NJ | $799,948 | $1,024,284 | $1,238,041 | $1,538,614 |
| BURLINGTON | NJ | $419,489 | $536,995 | $649,151 | $806,733 |
| CAMDEN | NJ | $419,489 | $536,995 | $649,151 | $806,733 |
| CAPE MAY | NJ | $419,489 | $536,995 | $649,151 | $806,733 |
| ESSEX | NJ | $799,948 | $1,024,284 | $1,238,041 | $1,538,614 |
| GLOUCESTER | NJ | $419,489 | $536,995 | $649,151 | $806,733 |
| HUDSON | NJ | $799,948 | $1,024,284 | $1,238,041 | $1,538,614 |
| HUNTERDON | NJ | $799,948 | $1,024,284 | $1,238,041 | $1,538,614 |
| MIDDLESEX | NJ | $799,948 | $1,024,284 | $1,238,041 | $1,538,614 |
| MONMOUTH | NJ | $799,948 | $1,024,284 | $1,238,041 | $1,538,614 |
| MORRIS | NJ | $799,948 | $1,024,284 | $1,238,041 | $1,538,614 |
| OCEAN | NJ | $799,948 | $1,024,284 | $1,238,041 | $1,538,614 |
| PASSAIC | NJ | $799,948 | $1,024,284 | $1,238,041 | $1,538,614 |
| SALEM | NJ | $419,489 | $536,995 | $649,151 | $806,733 |
| SOMERSET | NJ | $799,948 | $1,024,284 | $1,238,041 | $1,538,614 |
| SUSSEX | NJ | $799,948 | $1,024,284 | $1,238,041 | $1,538,614 |
| UNION | NJ | $799,948 | $1,024,284 | $1,238,041 | $1,538,614 |
| WARREN | NJ | $362,439 | $463,992 | $560,827 | $697,009 |
| CATRON | NM | $390,405 | $499,788 | $604,113 | $750,801 |
| LOS ALAMOS | NM | $482,133 | $617,197 | $746,083 | $927,205 |
| SANTA FE | NM | $402,710 | $515,546 | $623,179 | $774,438 |
| CARSON CITY | NV | $369,151 | $472,552 | $571,235 | $709,898 |
| CLARK | NV | $352,371 | $451,103 | $545,263 | $677,652 |
| DOUGLAS | NV | $486,608 | $622,936 | $752,990 | $935,814 |
| STOREY | NV | $447,455 | $572,791 | $692,389 | $860,476 |
| WASHOE | NV | $447,455 | $572,791 | $692,389 | $860,476 |
| BRONX | NY | $799,948 | $1,024,284 | $1,238,041 | $1,538,614 |
| DUTCHESS | NY | $346,778 | $443,905 | $536,606 | $666,854 |
| KINGS | NY | $799,948 | $1,024,284 | $1,238,041 | $1,538,614 |
| NASSAU | NY | $799,948 | $1,024,284 | $1,238,041 | $1,538,614 |
| NEW YORK | NY | $799,948 | $1,024,284 | $1,238,041 | $1,538,614 |
| ORANGE | NY | $346,778 | $443,905 | $536,606 | $666,854 |
| PUTNAM | NY | $799,948 | $1,024,284 | $1,238,041 | $1,538,614 |
| QUEENS | NY | $799,948 | $1,024,284 | $1,238,041 | $1,538,614 |
| RICHMOND | NY | $799,948 | $1,024,284 | $1,238,041 | $1,538,614 |
| ROCKLAND | NY | $799,948 | $1,024,284 | $1,238,041 | $1,538,614 |
| SUFFOLK | NY | $799,948 | $1,024,284 | $1,238,041 | $1,538,614 |
| WESTCHESTER | NY | $799,948 | $1,024,284 | $1,238,041 | $1,538,614 |
| DELAWARE | OH | $387,049 | $495,460 | $598,909 | $744,332 |
| FAIRFIELD | OH | $387,049 | $495,460 | $598,909 | $744,332 |
| FRANKLIN | OH | $387,049 | $495,460 | $598,909 | $744,332 |
| HOCKING | OH | $387,049 | $495,460 | $598,909 | $744,332 |
| LICKING | OH | $387,049 | $495,460 | $598,909 | $744,332 |
| MADISON | OH | $387,049 | $495,460 | $598,909 | $744,332 |
| MORROW | OH | $387,049 | $495,460 | $598,909 | $744,332 |
| PERRY | OH | $387,049 | $495,460 | $598,909 | $744,332 |
| PICKAWAY | OH | $387,049 | $495,460 | $598,909 | $744,332 |
| UNION | OH | $387,049 | $495,460 | $598,909 | $744,332 |
| BENTON | OR | $418,371 | $535,585 | $647,400 | $804,544 |
| CLACKAMAS | OR | $503,387 | $644,433 | $778,961 | $968,060 |
| CLATSOP | OR | $369,151 | $472,552 | $571,235 | $709,898 |
| COLUMBIA | OR | $503,387 | $644,433 | $778,961 | $968,060 |
| DESCHUTES | OR | $447,455 | $572,791 | $692,389 | $860,476 |
| HOOD RIVER | OR | $464,235 | $594,289 | $718,360 | $892,771 |
| JACKSON | OR | $346,778 | $443,905 | $536,606 | $666,854 |
| MARION | OR | $357,964 | $458,253 | $553,921 | $688,400 |
| MULTNOMAH | OR | $503,387 | $644,433 | $778,961 | $968,060 |
| POLK | OR | $357,964 | $458,253 | $553,921 | $688,400 |
| WASHINGTON | OR | $503,387 | $644,433 | $778,961 | $968,060 |
| YAMHILL | OR | $503,387 | $644,433 | $778,961 | $968,060 |
| BUCKS | PA | $419,489 | $536,995 | $649,151 | $806,733 |
| CARBON | PA | $362,439 | $463,992 | $560,827 | $697,009 |
| CHESTER | PA | $419,489 | $536,995 | $649,151 | $806,733 |
| DELAWARE | PA | $419,489 | $536,995 | $649,151 | $806,733 |
| LEHIGH | PA | $362,439 | $463,992 | $560,827 | $697,009 |
| MONTGOMERY | PA | $419,489 | $536,995 | $649,151 | $806,733 |
| NORTHAMPTON | PA | $362,439 | $463,992 | $560,827 | $697,009 |
| PHILADELPHIA | PA | $419,489 | $536,995 | $649,151 | $806,733 |
| PIKE | PA | $799,948 | $1,024,284 | $1,238,041 | $1,538,614 |
| BRISTOL | RI | $492,201 | $630,085 | $761,647 | $946,563 |
| KENT | RI | $492,201 | $630,085 | $761,647 | $946,563 |
| NEWPORT | RI | $492,201 | $630,085 | $761,647 | $946,563 |
| PROVIDENCE | RI | $492,201 | $630,085 | $761,647 | $946,563 |
| WASHINGTON | RI | $492,201 | $630,085 | $761,647 | $946,563 |
| BEAUFORT | SC | $369,151 | $472,552 | $571,235 | $709,898 |
| BERKELEY | SC | $402,710 | $515,546 | $623,179 | $774,438 |
| CHARLESTON | SC | $402,710 | $515,546 | $623,179 | $774,438 |
| DORCHESTER | SC | $402,710 | $515,546 | $623,179 | $774,438 |
| JASPER | SC | $369,151 | $472,552 | $571,235 | $709,898 |
| CANNON | TN | $570,506 | $730,325 | $882,800 | $1,097,141 |
| CHEATHAM | TN | $570,506 | $730,325 | $882,800 | $1,097,141 |
| DAVIDSON | TN | $570,506 | $730,325 | $882,800 | $1,097,141 |
| DICKSON | TN | $570,506 | $730,325 | $882,800 | $1,097,141 |
| MACON | TN | $570,506 | $730,325 | $882,800 | $1,097,141 |
| MAURY | TN | $570,506 | $730,325 | $882,800 | $1,097,141 |
| ROBERTSON | TN | $570,506 | $730,325 | $882,800 | $1,097,141 |
| RUTHERFORD | TN | $570,506 | $730,325 | $882,800 | $1,097,141 |
| SMITH | TN | $570,506 | $730,325 | $882,800 | $1,097,141 |
| SUMNER | TN | $570,506 | $730,325 | $882,800 | $1,097,141 |
| TROUSDALE | TN | $570,506 | $730,325 | $882,800 | $1,097,141 |
| WILLIAMSON | TN | $570,506 | $730,325 | $882,800 | $1,097,141 |
| WILSON | TN | $570,506 | $730,325 | $882,800 | $1,097,141 |
| ATASCOSA | TX | $392,642 | $502,658 | $607,567 | $755,081 |
| BANDERA | TX | $392,642 | $502,658 | $607,567 | $755,081 |
| BASTROP | TX | $404,947 | $518,416 | $626,632 | $778,767 |
| BEXAR | TX | $392,642 | $502,658 | $607,567 | $755,081 |
| CALDWELL | TX | $404,947 | $518,416 | $626,632 | $778,767 |
| COLLIN | TX | $400,473 | $512,677 | $619,677 | $770,158 |
| COMAL | TX | $392,642 | $502,658 | $607,567 | $755,081 |
| DALLAS | TX | $400,473 | $512,677 | $619,677 | $770,158 |
| DENTON | TX | $400,473 | $512,677 | $619,677 | $770,158 |
| ELLIS | TX | $400,473 | $512,677 | $619,677 | $770,158 |
| GUADALUPE | TX | $392,642 | $502,658 | $607,567 | $755,081 |
| HAYS | TX | $404,947 | $518,416 | $626,632 | $778,767 |
| HUNT | TX | $400,473 | $512,677 | $619,677 | $770,158 |
| JOHNSON | TX | $400,473 | $512,677 | $619,677 | $770,158 |
| KAUFMAN | TX | $400,473 | $512,677 | $619,677 | $770,158 |
| KENDALL | TX | $392,642 | $502,658 | $607,567 | $755,081 |
| MEDINA | TX | $392,642 | $502,658 | $607,567 | $755,081 |
| PARKER | TX | $400,473 | $512,677 | $619,677 | $770,158 |
| ROCKWALL | TX | $400,473 | $512,677 | $619,677 | $770,158 |
| TARRANT | TX | $400,473 | $512,677 | $619,677 | $770,158 |
| TRAVIS | TX | $404,947 | $518,416 | $626,632 | $778,767 |
| WILLIAMSON | TX | $404,947 | $518,416 | $626,632 | $778,767 |
| WILSON | TX | $392,642 | $502,658 | $607,567 | $755,081 |
| WISE | TX | $400,473 | $512,677 | $619,677 | $770,158 |
| BOX ELDER | UT | $628,675 | $804,836 | $972,826 | $1,209,005 |
| DAVIS | UT | $628,675 | $804,836 | $972,826 | $1,209,005 |
| JUAB | UT | $427,320 | $547,014 | $661,261 | $821,761 |
| MORGAN | UT | $628,675 | $804,836 | $972,826 | $1,209,005 |
| RICH | UT | $364,676 | $466,861 | $564,329 | $701,289 |
| SALT LAKE | UT | $440,744 | $564,231 | $682,029 | $847,587 |
| SUMMIT | UT | $795,352 | $1,018,204 | $1,230,745 | $1,529,568 |
| TOOELE | UT | $440,744 | $564,231 | $682,029 | $847,587 |
| UTAH | UT | $427,320 | $547,014 | $661,261 | $821,761 |
| WASATCH | UT | $795,352 | $1,018,204 | $1,230,745 | $1,529,568 |
| WASHINGTON | UT | $402,710 | $515,546 | $623,179 | $774,438 |
| WEBER | UT | $628,675 | $804,836 | $972,826 | $1,209,005 |
| ALBEMARLE | VA | $425,083 | $544,193 | $657,759 | $817,481 |
| ALEXANDRIA CITY | VA | $799,948 | $1,024,284 | $1,238,041 | $1,538,614 |
| AMELIA | VA | $521,285 | $667,341 | $806,636 | $1,002,495 |
| ARLINGTON | VA | $799,948 | $1,024,284 | $1,238,041 | $1,538,614 |
| CHARLES CITY | VA | $521,285 | $667,341 | $806,636 | $1,002,495 |
| CHARLOTTESVILLE | VA | $425,083 | $544,193 | $657,759 | $817,481 |
| CHESAPEAKE CITY | VA | $446,337 | $571,381 | $690,686 | $858,336 |
| CHESTERFIELD | VA | $521,285 | $667,341 | $806,636 | $1,002,495 |
| CLARKE | VA | $799,948 | $1,024,284 | $1,238,041 | $1,538,614 |
| COLONIAL HEIGHT | VA | $521,285 | $667,341 | $806,636 | $1,002,495 |
| CULPEPER | VA | $799,948 | $1,024,284 | $1,238,041 | $1,538,614 |
| DINWIDDIE | VA | $521,285 | $667,341 | $806,636 | $1,002,495 |
| FAIRFAX | VA | $799,948 | $1,024,284 | $1,238,041 | $1,538,614 |
| FAIRFAX CITY | VA | $799,948 | $1,024,284 | $1,238,041 | $1,538,614 |
| FALLS CHURCH CI | VA | $799,948 | $1,024,284 | $1,238,041 | $1,538,614 |
| FAUQUIER | VA | $799,948 | $1,024,284 | $1,238,041 | $1,538,614 |
| FLUVANNA | VA | $425,083 | $544,193 | $657,759 | $817,481 |
| FRANKLIN CITY | VA | $446,337 | $571,381 | $690,686 | $858,336 |
| FREDERICKSBURG | VA | $799,948 | $1,024,284 | $1,238,041 | $1,538,614 |
| GLOUCESTER | VA | $446,337 | $571,381 | $690,686 | $858,336 |
| GOOCHLAND | VA | $521,285 | $667,341 | $806,636 | $1,002,495 |
| GREENE | VA | $425,083 | $544,193 | $657,759 | $817,481 |
| HAMPTON CITY | VA | $446,337 | $571,381 | $690,686 | $858,336 |
| HANOVER | VA | $521,285 | $667,341 | $806,636 | $1,002,495 |
| HENRICO | VA | $521,285 | $667,341 | $806,636 | $1,002,495 |
| HOPEWELL CITY | VA | $521,285 | $667,341 | $806,636 | $1,002,495 |
| ISLE OF WIGHT | VA | $446,337 | $571,381 | $690,686 | $858,336 |
| JAMES CITY | VA | $446,337 | $571,381 | $690,686 | $858,336 |
| KING AND QUEEN | VA | $521,285 | $667,341 | $806,636 | $1,002,495 |
| KING GEORGE | VA | $349,015 | $446,774 | $540,059 | $671,183 |
| KING WILLIAM | VA | $521,285 | $667,341 | $806,636 | $1,002,495 |
| LANCASTER | VA | $430,676 | $551,343 | $666,417 | $828,230 |
| LOUDOUN | VA | $799,948 | $1,024,284 | $1,238,041 | $1,538,614 |
| MADISON | VA | $799,948 | $1,024,284 | $1,238,041 | $1,538,614 |
| MANASSAS CITY | VA | $799,948 | $1,024,284 | $1,238,041 | $1,538,614 |
| MANASSAS PARK C | VA | $799,948 | $1,024,284 | $1,238,041 | $1,538,614 |
| MATHEWS | VA | $446,337 | $571,381 | $690,686 | $858,336 |
| NELSON | VA | $425,083 | $544,193 | $657,759 | $817,481 |
| NEW KENT | VA | $521,285 | $667,341 | $806,636 | $1,002,495 |
| NEWPORT NEWS CI | VA | $446,337 | $571,381 | $690,686 | $858,336 |
| NORFOLK CITY | VA | $446,337 | $571,381 | $690,686 | $858,336 |
| PETERSBURG CITY | VA | $521,285 | $667,341 | $806,636 | $1,002,495 |
| POQUOSON CITY | VA | $446,337 | $571,381 | $690,686 | $858,336 |
| PORTSMOUTH CITY | VA | $446,337 | $571,381 | $690,686 | $858,336 |
| POWHATAN | VA | $521,285 | $667,341 | $806,636 | $1,002,495 |
| PRINCE GEORGE | VA | $521,285 | $667,341 | $806,636 | $1,002,495 |
| PRINCE WILLIAM | VA | $799,948 | $1,024,284 | $1,238,041 | $1,538,614 |
| RAPPAHANNOCK | VA | $799,948 | $1,024,284 | $1,238,041 | $1,538,614 |
| RICHMOND CITY | VA | $521,285 | $667,341 | $806,636 | $1,002,495 |
| SOUTHAMPTON | VA | $446,337 | $571,381 | $690,686 | $858,336 |
| SPOTSYLVANIA | VA | $799,948 | $1,024,284 | $1,238,041 | $1,538,614 |
| STAFFORD | VA | $799,948 | $1,024,284 | $1,238,041 | $1,538,614 |
| SUFFOLK CITY | VA | $446,337 | $571,381 | $690,686 | $858,336 |
| SUSSEX | VA | $521,285 | $667,341 | $806,636 | $1,002,495 |
| VIRGINIA BEACH | VA | $446,337 | $571,381 | $690,686 | $858,336 |
| WARREN | VA | $799,948 | $1,024,284 | $1,238,041 | $1,538,614 |
| WILLIAMSBURG CI | VA | $446,337 | $571,381 | $690,686 | $858,336 |
| YORK | VA | $446,337 | $571,381 | $690,686 | $858,336 |
| CHITTENDEN | VT | $369,151 | $472,552 | $571,235 | $709,898 |
| FRANKLIN | VT | $369,151 | $472,552 | $571,235 | $709,898 |
| GRAND ISLE | VT | $369,151 | $472,552 | $571,235 | $709,898 |
| CHELAN | WA | $361,320 | $462,533 | $559,125 | $694,869 |
| CLALLAM | WA | $373,625 | $478,291 | $578,141 | $718,506 |
| CLARK | WA | $503,387 | $644,433 | $778,961 | $968,060 |
| DOUGLAS | WA | $361,320 | $462,533 | $559,125 | $694,869 |
| ISLAND | WA | $419,489 | $536,995 | $649,151 | $806,733 |
| KING | WA | $755,081 | $966,649 | $1,168,442 | $1,452,090 |
| KITSAP | WA | $423,964 | $542,734 | $656,057 | $815,341 |
| PIERCE | WA | $755,081 | $966,649 | $1,168,442 | $1,452,090 |
| SAN JUAN | WA | $484,370 | $620,066 | $749,536 | $931,485 |
| SKAGIT | WA | $394,879 | $505,527 | $611,068 | $759,361 |
| SKAMANIA | WA | $503,387 | $644,433 | $778,961 | $968,060 |
| SNOHOMISH | WA | $755,081 | $966,649 | $1,168,442 | $1,452,090 |
| THURSTON | WA | $394,879 | $505,527 | $611,068 | $759,361 |
| WHATCOM | WA | $430,676 | $551,343 | $666,417 | $828,230 |
| KENOSHA | WI | $369,151 | $472,552 | $571,235 | $709,898 |
| MILWAUKEE | WI | $352,371 | $451,103 | $545,263 | $677,652 |
| OZAUKEE | WI | $352,371 | $451,103 | $545,263 | $677,652 |
| PIERCE | WI | $391,523 | $501,199 | $605,864 | $752,941 |
| ST. CROIX | WI | $391,523 | $501,199 | $605,864 | $752,941 |
| WASHINGTON | WI | $352,371 | $451,103 | $545,263 | $677,652 |
| WAUKESHA | WI | $352,371 | $451,103 | $545,263 | $677,652 |
| JEFFERSON | WV | $799,948 | $1,024,284 | $1,238,041 | $1,538,614 |
| SHERIDAN | WY | $476,540 | $610,047 | $737,426 | $916,408 |
| TETON | WY | $799,948 | $1,024,284 | $1,238,041 | $1,538,614 |
| GUAM | GU | $548,133 | $701,727 | $848,220 | $1,054,098 |
| NORTHERN ISLAND | MP | $510,099 | $652,993 | $789,321 | $980,949 |
| ROTA | MP | $399,354 | $511,218 | $617,975 | $767,970 |
| SAIPAN | MP | $514,574 | $658,732 | $796,276 | $989,557 |
| TINIAN | MP | $517,930 | $663,061 | $801,480 | $996,026 |
| AGUAS BUENAS | PR | $374,744 | $479,750 | $579,892 | $720,646 |
| AIBONITO | PR | $374,744 | $479,750 | $579,892 | $720,646 |
| BARCELONETA | PR | $374,744 | $479,750 | $579,892 | $720,646 |
| BARRANQUITAS | PR | $374,744 | $479,750 | $579,892 | $720,646 |
| BAYAMON | PR | $374,744 | $479,750 | $579,892 | $720,646 |
| CAGUAS | PR | $374,744 | $479,750 | $579,892 | $720,646 |
| CANOVANAS | PR | $374,744 | $479,750 | $579,892 | $720,646 |
| CAROLINA | PR | $374,744 | $479,750 | $579,892 | $720,646 |
| CATANO | PR | $374,744 | $479,750 | $579,892 | $720,646 |
| CAYEY | PR | $374,744 | $479,750 | $579,892 | $720,646 |
| CEIBA | PR | $374,744 | $479,750 | $579,892 | $720,646 |
| CIALES | PR | $374,744 | $479,750 | $579,892 | $720,646 |
| CIDRA | PR | $374,744 | $479,750 | $579,892 | $720,646 |
| COMERIO | PR | $374,744 | $479,750 | $579,892 | $720,646 |
| COROZAL | PR | $374,744 | $479,750 | $579,892 | $720,646 |
| DORADO | PR | $374,744 | $479,750 | $579,892 | $720,646 |
| FAJARDO | PR | $374,744 | $479,750 | $579,892 | $720,646 |
| FLORIDA | PR | $374,744 | $479,750 | $579,892 | $720,646 |
| GUAYNABO | PR | $374,744 | $479,750 | $579,892 | $720,646 |
| GURABO | PR | $374,744 | $479,750 | $579,892 | $720,646 |
| HUMACAO | PR | $374,744 | $479,750 | $579,892 | $720,646 |
| JUNCOS | PR | $374,744 | $479,750 | $579,892 | $720,646 |
| LAS PIEDRAS | PR | $374,744 | $479,750 | $579,892 | $720,646 |
| LOIZA | PR | $374,744 | $479,750 | $579,892 | $720,646 |
| LUQUILLO | PR | $374,744 | $479,750 | $579,892 | $720,646 |
| MANATI | PR | $374,744 | $479,750 | $579,892 | $720,646 |
| MAUNABO | PR | $374,744 | $479,750 | $579,892 | $720,646 |
| MOROVIS | PR | $374,744 | $479,750 | $579,892 | $720,646 |
| NAGUABO | PR | $374,744 | $479,750 | $579,892 | $720,646 |
| NARANJITO | PR | $374,744 | $479,750 | $579,892 | $720,646 |
| OROCOVIS | PR | $374,744 | $479,750 | $579,892 | $720,646 |
| RIO GRANDE | PR | $374,744 | $479,750 | $579,892 | $720,646 |
| SAN JUAN | PR | $374,744 | $479,750 | $579,892 | $720,646 |
| SAN LORENZO | PR | $374,744 | $479,750 | $579,892 | $720,646 |
| TOA ALTA | PR | $374,744 | $479,750 | $579,892 | $720,646 |
| TOA BAJA | PR | $374,744 | $479,750 | $579,892 | $720,646 |
| TRUJILLO ALTO | PR | $374,744 | $479,750 | $579,892 | $720,646 |
| VEGA ALTA | PR | $374,744 | $479,750 | $579,892 | $720,646 |
| VEGA BAJA | PR | $374,744 | $479,750 | $579,892 | $720,646 |
| YABUCOA | PR | $374,744 | $479,750 | $579,892 | $720,646 |
| ST. JOHN ISLAND | VI | $606,302 | $776,189 | $938,197 | $1,165,962 |
| ST. THOMAS ISLA | VI | $434,032 | $555,623 | $671,621 | $834,699 |
| All other areas - 2695 counties (floor): | $346,644 | $443,832 | $536,460 | $666,708 |
.02 The nationwide average purchase price (for use in the housing cost/income ratio for new and existing residences) is $331,900.
Rev. Proc. 2020-18 is obsolete except as provided in section 6 of this revenue procedure.
.01 Issuers may rely on this revenue procedure to determine average area purchase price safe harbors for commitments to provide financing or issue mortgage credit certificates that are made, or (if the purchase precedes the commitment) for residences that are purchased, in the period that begins on March 25, 2021, and ends on the date as of which the safe harbors contained in section 4.01 of this revenue procedure are rendered obsolete by a new revenue procedure.
.02 Notwithstanding section 5 of this revenue procedure, issuers may continue to rely on the average area purchase price safe harbors contained in Rev. Proc. 2020-18, with respect to bonds sold, or for mortgage credit certificates issued with respect to bond authority exchanged, before April 24, 2021, if the commitments to provide financing or issue mortgage credit certificates are made on or before May 24, 2021.
.03 Except as provided in section 6.04, issuers must use the nationwide average purchase price limitation contained in this revenue procedure for commitments to provide financing or issue mortgage credit certificates that are made, or (if the purchase precedes the commitment) for residences that are purchased, in the period that begins on March 25, 2021, and ends on the date when the nationwide average purchase price limitation is rendered obsolete by a new revenue procedure.
.04 Notwithstanding sections 5 and 6.03 of this revenue procedure, issuers may continue to rely on the nationwide average purchase price set forth in Rev. Proc. 2020-18 with respect to bonds sold, or for mortgage credit certificates issued with respect to bond authority exchanged, before April 24, 2021, if the commitments to provide financing or issue mortgage credit certificates are made on or before May 24, 2021.
The collection of information contained in this revenue procedure has been reviewed and approved by the Office of Management and Budget in accordance with the Paperwork Reduction Act (44 U.S.C. 3507) under control number 1545-1877.
An agency may not conduct or sponsor, and a person is not required to respond to, a collection of information unless the collection of information displays a valid OMB control number.
This revenue procedure contains a collection of information requirement in section 3.03. The purpose of the collection of information is to verify the applicable FHA loan limit that issuers of qualified mortgage bonds and qualified mortgage certificates have used to calculate the average area purchase price for a given metropolitan statistical area for purposes of §§ 143(e) and 25(c). The collection of information is required to obtain the benefit of using revisions to FHA loan limits to determine average area purchase prices. The likely respondents are state and local governments.
The estimated total annual reporting and/or recordkeeping burden is: 15 hours.
The estimated annual burden per respondent and/or recordkeeper: 15 minutes.
The estimated number of respondents and/or recordkeepers: 60.
Books or records relating to a collection of information must be retained as long as their contents may become material in the administration of any internal revenue law. Generally, tax returns and tax return information are confidential, as required by 26 U.S.C. 6103.
The principal authors of this revenue procedure are Jian H. Grant and David White of the Office of Associate Chief Counsel (Financial Institutions & Products). For further information regarding this revenue procedure contact Mr. White at (202) 317-4562 (not a toll-free number).
This revenue procedure provides an automatic procedure for a State or local government in which an empowerment zone is located to extend the empowerment zone designation made under section 1391(a) of the Internal Revenue Code (Code). Specifically, this revenue procedure provides that a State or local government that nominated an empowerment zone is deemed to extend until December 31, 2025, the termination date designated by that State or local government in its empowerment zone nomination (designated termination date), as described in section 1391(d)(1)(B). This revenue procedure further provides the procedure for such State or local government to decline this deemed extension of its designated termination date.
.01 Empowerment Zones. An empowerment zone is an area of high poverty and unemployment located in an urban or rural area that is designated under section 1391(a), as appropriate, by the Secretary of Housing and Urban Development or the Secretary of Agriculture, each Secretary an “appropriate Secretary” under section 1393(a)(1) of the Code. See section 1391(a); see generally section 1393. Qualifying taxpayers and businesses located within the boundaries of empowerment zones are eligible for Federal income tax incentives to promote economic development in those designated areas. See section 1394 of the Code (regarding tax-exempt enterprise zone facility bonds) and section 1396 of the Code (regarding empowerment zone employment credits).
.02 Empowerment Zone Designation and Extensions.
(1) Initial designation. As originally enacted in 1993, section 1391(d)(1) provided that the designation of an empowerment zone remained in effect during the period beginning on the date of the designation and ending on the earliest of (i) the close of the 10th calendar year beginning on or after such date of designation (statutory termination date), (ii) the termination date designated by a State or local government in its nomination (that is, the designated termination date), or (iii) the date the appropriate Secretary revokes the designation. See section 13301(a) of the Omnibus Budget Reconciliation Act of 1993 (OBRA of 1993), Public Law 103-66, 107 Stat. 312 (August 10, 1993) (adding section 1391(d)(1) to the Code).
(2) Extensions of statutory termination date and automatic extensions of designated termination date. The statutory termination date has been extended multiple times, most recently in 2020 to extend that date to December 31, 2025. See section 118(a) of the Taxpayer Certainty and Disaster Tax Relief Act of 2020 (TCDTRA of 2020), enacted as part of Title I of Division EE of the Consolidated Appropriations Act, 2021, Pub. L. No. 116-260, 134 Stat. 1182 (December 27, 2020). After each extension of the statutory termination date and pursuant to specific statutory grants of authority, the Department of the Treasury (Treasury Department) and the Internal Revenue Service (IRS) issued guidance automatically treating a designated termination date as extended to the date of the amended statutory termination date, unless the State or local government declined the extension in a written notification to the IRS. See, for example, section 3 of Rev. Proc. 2020-16, 2020-27 I.R.B. 10 (deemed extension to December 31, 2020); see also section 2 of Rev. Proc. 2020-16 (providing an overview of each extension of the statutory termination date).
(3) Current designated termination date of all empowerment zones. The IRS has received no written request from a State or local government to decline any extension of a designated termination date otherwise provided in the previous guidance described in section 2.02(2) of this revenue procedure. Therefore, as of March 26, 2021, all empowerment zones have a designated termination date of December 31, 2020, the latest statutory termination date prior to enactment of the TCDTRA of 2020.
.03 Statutory authority to extend current designated termination date. Section 118(d) of the TCDTRA of 2020 provides that, if a nomination for an empowerment zone includes a designated termination date of December 31, 2020, section 1391(d)(1)(B) does not apply to the designation if, after the date of enactment of the TCDTRA of 2020, the State or local government that made such nomination amends the nomination to provide a new termination date in such manner as may be provided by the Secretary of the Treasury (or the Secretary’s designee). Accordingly, section 3.01 of this revenue procedure sets forth an automatic extension procedure to extend a designated termination date to December 31, 2025, and section 3.02 of this revenue procedure sets forth a written declination procedure consistent with the previous guidance described above.
.01 Automatic extension. Subject to declination by written notification pursuant to section 3.02 of this revenue procedure, the designated termination date with regard to all empowerment zones is deemed to be extended from December 31, 2020, to December 31, 2025. Accordingly, the designated termination date is deemed to be the same date as the date provided in section 1391(d)(1)(A)(i) (that is, December 31, 2025). Therefore, section 1391(d)(1)(B) does not apply and the designation of all empowerment zones will remain in effect until December 31, 2025 (unless terminated at an earlier date by the appropriate Secretary under section 1391(d)(1)(C)).
.02 Declination of automatic extension.
(1) In general. Pursuant to section 3.02(2) of this revenue procedure, a State or local government may decline the extension of a designated termination date described in section 3.01 of this revenue procedure.
(2) Form and manner.
(a) Deadline for written notification. To make a declination under section 3.02(1) of this revenue procedure, not later than May 25, 2021, the State or local government must provide written notification to the IRS that affirmatively declines the December 31, 2025, designated termination date extension under section 3.01 of this revenue procedure.
(b) Electronic delivery. This written notification must be sent by electronic facsimile to Bruce Chang, CC:ITA:B07, at facsimile number (855) 576-2341.
Rev. Proc. 2020-16 is obsoleted for taxable years beginning after 2020.
This revenue procedure is effective for taxable years beginning after December 31, 2020, the effective date of the amendments made by section 118 of the TCDTRA of 2020.
This revenue procedure provides guidance with respect to the United States and area median gross income figures for use by issuers of qualified mortgage bonds, as defined in § 143(a) of the Internal Revenue Code, and issuers of mortgage credit certificates, as defined in § 25(c), in computing the income requirements described in § 143(f).
.01 Section 103(a) provides that, except as provided in § 103(b), gross income does not include interest on any State or local bond. Section 103(b)(1) provides that § 103(a) does not apply to any private activity bond that is not a qualified bond (within the meaning of § 141). Section 141(e) provides that the term “qualified bond” includes any private activity bond that (1) is a qualified mortgage bond, (2) meets the applicable volume cap requirements under § 146, and (3) meets the applicable requirements under § 147.
.02 Section 143(a)(1) provides that the term “qualified mortgage bond” means a bond that is issued as part of a “qualified mortgage issue”. Section 143(a)(2)(A) provides that the term “qualified mortgage issue” means an issue of one or more bonds by a State or political subdivision thereof, but only if: (i) all proceeds of the issue (exclusive of issuance costs and a reasonably required reserve) are to be used to finance owner-occupied residences; (ii) the issue meets the requirements of subsections (c), (d), (e), (f), (g), (h), (i), and (m)(7) of § 143; (iii) the issue does not meet the private business tests of paragraphs (1) and (2) of § 141(b); and (iv) with respect to amounts received more than 10 years after the date of issuance, repayments of $250,000 or more of principal on financing provided by the issue are used not later than the close of the first semi-annual period beginning after the date the prepayment (or complete repayment) is received to redeem bonds that are part of the issue.
.03 Section 25(c)(1) provides that the term “mortgage credit certificate” means any certificate that: (1) is issued under a qualified mortgage credit certificate program by the State or political subdivision having the authority to issue a qualified mortgage bond to provide financing on the principal residence of the taxpayer; (2) is issued to the taxpayer in connection with the acquisition, qualified rehabilitation, or qualified home improvement of the taxpayer’s principal residence; (3) specifies the certificate credit rate and the certified indebtedness amount; and (4) is in such form as the Secretary of the Treasury or the Secretary’s delegate (Secretary) may prescribe.
.04 Section 25(c)(2) provides that the term “qualified mortgage credit certificate program” means any program under which, among other requirements, the indebtedness certified by mortgage credit certificates meets the requirements of § 143(f). See § 25(c)(2)(A)(iii)(IV).
.05 Section 143(f) imposes eligibility requirements concerning the maximum income of mortgagors for whom financing may be provided by qualified mortgage bonds. Generally, under §§ 143(f)(1) and 25(c)(2)(A)(iii)(IV), these income requirements are met only if all owner-financing under a qualified mortgage bond and all certified indebtedness amounts under a mortgage credit certificate program are provided to mortgagors whose family income is 115 percent or less of the applicable median family income. Under § 143(f)(3), in the case of targeted area residences, the income limitation of § 143(a) applies to 2/3 of the owner financing and is treated as satisfied if the family income of the mortgagor is 140 percent or less of the applicable median family income. Under § 143(f)(6), if there are fewer than three individuals in the family of the mortgagor, the income limitation of § 143(a) is reduced to 100 percent of the applicable median family income and, in the case of targeted area residences, the income limitation of § 143(a) is satisfied if the family income of the mortgagor is 120 percent or less of the applicable median family income.
.06 Section 143(f)(2) provides that, for purposes of § 143(f), the family income of mortgagors, and area median gross income, are determined by the Secretary after taking into account the regulations prescribed under section 8 of the United States Housing Act of 1937 (if terminated, a successor program) (Housing Act).
.07 Section 143(f)(4) provides that the term “applicable median family income” means, with respect to a residence, the greater of (A) the area median gross income for the area in which the residence is located, or (B) the statewide median gross income for the state in which the residence is located.
.08 Section 143(f)(5) provides for an upward adjustment of the income limitations in certain high housing cost areas. Under § 143(f)(5)(C), a high housing cost area is a statistical area for which the housing cost/income ratio is greater than 1.2. The housing cost/income ratio with respect to any statistical area is determined under § 143(f)(5)(D) by dividing (a) the applicable housing price ratio for such area by (b) the ratio that the area median gross income for such area bears to the median gross income for the United States. The applicable housing price ratio for any area is the new housing price ratio (new housing average purchase price for the area divided by the new housing average purchase price for the United States) or the existing housing price ratio (existing housing average purchase price for the area divided by the existing housing average purchase price for the United States), whichever results in the housing cost/income ratio being closer to 1.
.09 The Department of Housing and Urban Development (HUD) annually computes the median gross income (adjusted by family size) for the United States, the states, and statistical areas within the states. HUD releases the annually updated income figures to its regional offices in a notice. The most recent income figures are generally available by calling the HUD reference service at 1-800-245-2691, or at HUD’s website, http://www.huduser.gov/portal/datasets/il.html (including a menu from which the year and type of data of interest may be selected).
.10 Rev. Rul. 86-124, 1986-2 C.B. 27, provides the manner in which the income limits under § 143(f) applicable to qualified mortgage bonds and mortgage credit certificates are determined. In particular, the revenue ruling provides that, for purposes of § 143(f)(4), to determine the area median gross income for an area or state in a manner consistent with the determination of “median gross income” for the area or state under section 8 of the Housing Act, issuers must use the income limits released by HUD for Lower Income and Very Low Income under the Housing Act. Further, Rev. Rul. 86-124 provides the manner in which issuers must apply these income limits. See generally, Rev. Rul. 86-124, Guidelines.
.11 The Internal Revenue Service (IRS) has published a revenue procedure in the Internal Revenue Bulletin annually, providing guidance with respect to the United States and area median gross income figures that are to be used by issuers of qualified mortgage bonds and issuers of mortgage credit certificates for purposes of computing the income requirements under § 143(f). See, e.g., Rev. Proc. 2020-33, 2020-25 I.R.B. 956.
.12 The IRS has also published a revenue procedure in the Internal Revenue Bulletin annually, providing the most recent nationwide average purchase prices and average area purchase price safe harbor limitations for purposes of § 143(f)(5). See, e.g., Rev. Proc. 2020-18, 2020-15 I.R.B. 592.
.13 The Department of the Treasury (Treasury Department) and the IRS requested public comments on whether, instead of publishing a revenue procedure annually, such as Rev. Proc. 2020-33, the IRS should publish permanent guidance that would allow issuers to rely on the HUD income figures immediately upon release. See Rev. Proc. 2020-33, Section 6. The Treasury Department and the IRS also requested public comments on the two-year convention with respect to the issuers’ reliance on the HUD income figures, as provided in section 3.01 of Rev. Proc. 2020-33, and a transition period, if necessary. See Rev. Proc. 2020-33, Section 6. Comments received consistently favored publication of permanent guidance, retention of the two-year convention, and provision of a transition period, such as a period of 90 days following the release of the HUD income figures. As a result, the Treasury Department and the IRS have decided to publish this revenue procedure as permanent guidance consistent with comments received and to cease publishing annual revenue procedures providing income figures for purposes of computing the income requirements of § 143(f).
This revenue procedure applies to mortgage loans financed with qualified mortgage bonds and to mortgage credit certificates.
.01 Applicable Income Figures. Except as provided in section 4.02 of this revenue procedure, for purposes of computing the income requirements of § 143(f), issuers of qualified mortgage bonds or mortgage credit certificates must use either (1) the income figures HUD released most recently (Most Recent HUD Figures) or (2) the income figures HUD released immediately prior to the Most Recent HUD Figures (Immediately Prior HUD Figures), determined as of the date a mortgage loan or mortgage credit certificate is committed to a mortgagor.
.02 Transition Period. For mortgage loans and mortgage credit certificates committed to mortgagors no later than 90 days after the date on which HUD releases updated income figures for the calendar year, issuers of qualified mortgage bonds or mortgage credit certificates may continue to use the income figures HUD released during the second preceding calendar year for purposes of computing the income requirements of § 143(f).
.03 Consistency Requirement. If an issuer uses the Most Recent HUD Figures to compute the housing cost/income ratio under § 143(f)(5), the issuer must use the Most Recent HUD Figures for all purposes under § 143(f). Likewise, if an issuer uses the Immediately Prior HUD Figures to compute the housing cost/income ratio under § 143(f)(5), the issuer must use the Immediately Prior HUD Figures for all purposes under § 143(f). For example, if an issuer uses the income figures HUD released in 2021 to compute the housing cost/income ratio under § 143(f)(5), the issuer must use the income figures HUD released in 2021 for all purposes under § 143(f). Likewise, if an issuer uses the income figures HUD released in 2020 to compute the housing cost/income ratio under § 143(f)(5), the issuer must use the income figures HUD released in 2020 for all purposes under § 143(f).
.01 This revenue procedure obsoletes Rev. Proc. 2020-33.
.02 This revenue procedure amplifies Rev. Rul. 86-124.
This revenue procedure is effective for mortgage loans and mortgage credit certificates committed on or after March 25, 2021.
This Announcement is issued pursuant to § 521(b) of Pub. L. 106-170, the Ticket to Work and Work Incentives Improvement Act of 1999, which requires the Secretary of the Treasury to report annually to the public concerning advance pricing agreements (APAs) and the Advance Pricing and Mutual Agreement Program (APMA Program), formerly known as the Advance Pricing Agreement Program (APA Program). The first report covered calendar years 1991 through 1999. Subsequent reports covered each calendar year 2000 through 2019 separately. This twenty-second report describes the experience, structure, and activities of the APMA Program during calendar year 2020. It does not provide guidance regarding the application of the arm’s length standard.
Part I of this report includes information on the structure, composition, and operation of the APMA Program; Part II presents statistical data; and Part III includes general descriptions of various elements of the APAs executed in 2020, including types of transactions covered, transfer pricing methods used, and completion time.
John C. C. Hughes
Director, Advance Pricing and Mutual Agreement Program
In February 2012, the former APA Program was moved from the Office of Chief Counsel to the Office of Transfer Pricing Operations1 within the Large Business and International Division of the IRS and combined with the U.S. Competent Authority staff responsible for transfer pricing cases, thereby forming the APMA Program.
In September 2018, APMA restructured its management and realigned its teams. As of December 31, 2020, the APMA Program comprised 64 team leaders, 21 economists, 9 managers, and 3 assistant directors. Each assistant director oversees 3 managers who lead teams comprised of both team leaders and economists. The APMA Program’s main office is in Washington, DC, and it also has offices in northern California (San Francisco and San Jose), southern California (Los Angeles and Laguna Niguel), Chicago, and New York.
On August 31, 2015, new revenue procedures governing requests under the mutual agreement procedure (MAP) and APA applications were published in 2015-35 I.R.B. on pages 236 and 263, respectively. Revenue Procedure (Rev. Proc.) 2015-41 provides guidance and instructions on filing APA requests as well as guidance and information on the administration of APAs. Rev. Proc. 2015-41 updates and supersedes Rev. Proc. 2006-9, 2006-1 C.B. 278, as modified by Rev. Proc. 2008-31, 2008-1 C.B. 1133, which is also superseded. Rev. Proc. 2015-40 provides procedures and guidance on requesting assistance from the U.S. Competent Authority where the taxpayer believes that the actions of the United States or a treaty country result or will result in the taxpayer being subject to taxation not in accordance with the applicable U.S. tax treaty. Rev. Proc. 2015-40 updates and supersedes Rev. Proc. 2006-54, 2006-2 C.B. 1035.
Model APAs appear as appendices to this report. Appendix 1 is the model for APAs covered by Rev. Proc. 2006-9. Appendix 2 is the current model APA for APAs covered by Rev. Proc. 2015-41. A list of primary APMA contacts is available at https://www.irs.gov/businesses/corporations/apma-contacts.
Table 1: APA Applications Filed § 521(b)(2)(C)(i)2
| Unilateral | Bilateral | Multilateral | Total | |
|---|---|---|---|---|
| Filed 1991-19992 | 401 | |||
| Filed 2000-2019 | 622 | 1,621 | 26 | 2,269 |
| Filed in 2020 | 15 | 103 | 3 | 121 |
| Total Filed 1991-2020 | 2,791 |
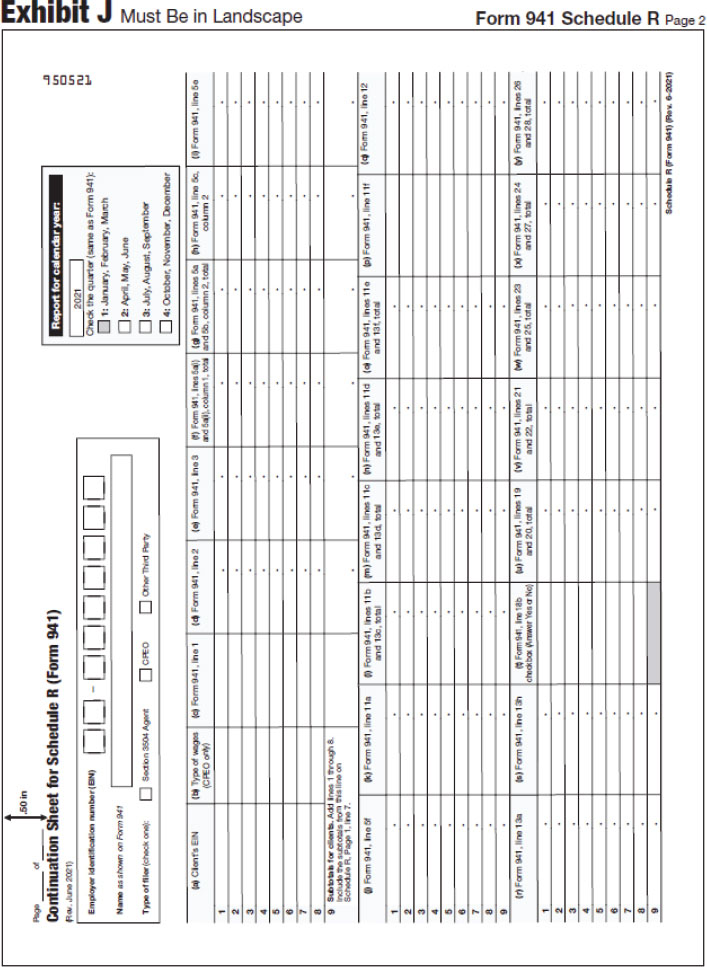
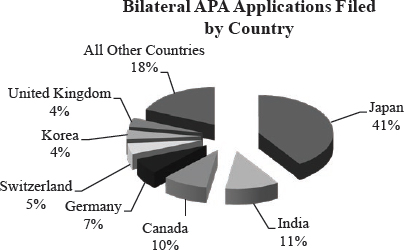
The charts above illustrate the number of complete applications filed per year and the bilateral requests received in 2020 by foreign country. As of December 31, 2020, APMA had also received 25 user fee filings that were not yet accompanied by substantially complete APA applications, in addition to the 121 complete APA applications.
Table 2: Executed3 and Pending APAs § 521(b)(2)(C)(ii-vi)45
| Unilateral | Bilateral | Multilateral | Total | |
|---|---|---|---|---|
| Total Executed 1991-2019 | 643 | 1,280 | 17 | 1,940 |
| Total Executed in 2020 | 19 | 105 | 3 | 127 |
| Total Executed 1991-2020 | 662 | 1,385 | 20 | 2,067 |
| Total Pending as of 12/31/2020 | 43 | 384 | 21 | 448 |
| Renewals Executed in 20204 | 11 | 64 | 0 | 75 |
| Renewals Pending5 as of 12/31/2020 | 25 | 154 | 8 | 187 |
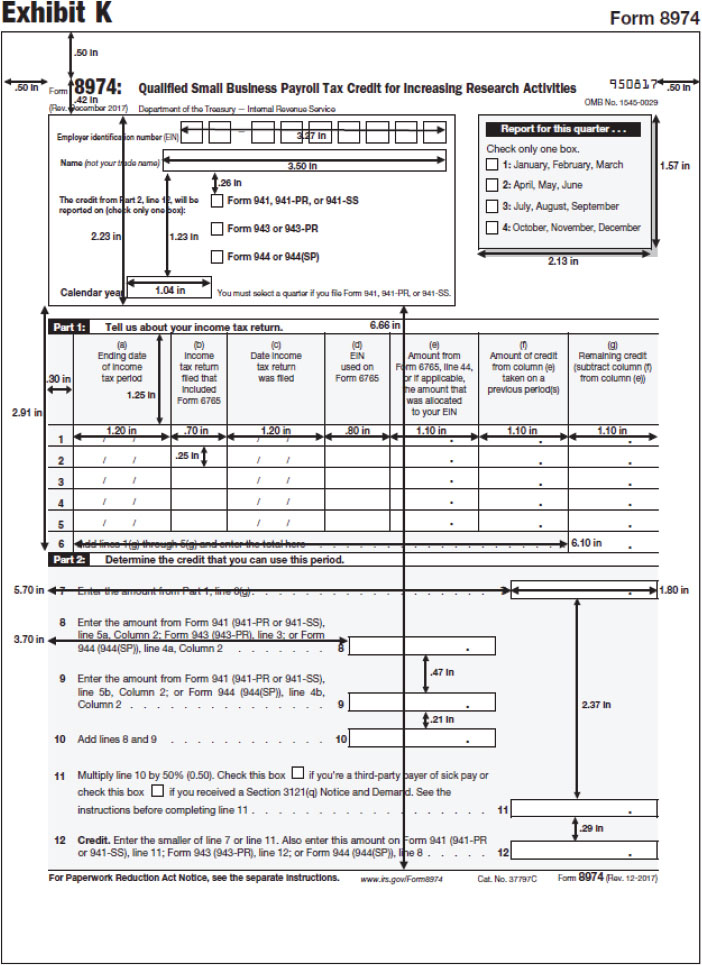
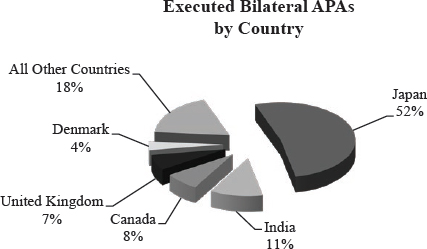
In 2020, the percentage of renewals executed remained fairly consistent (59 percent in 2020 versus 57 percent in 2019). The charts above illustrate the total number of APAs executed per year and the countries involved in the executed bilateral APAs.
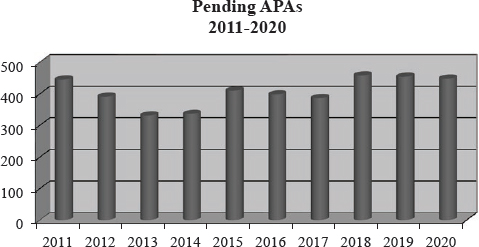
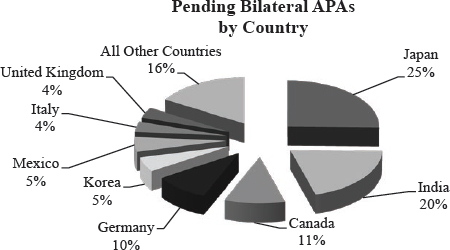
As the top chart illustrates, the number of pending requests decreased slightly relative to December 31, 2019. As of December 31, 2020, over half of the pending bilateral APA requests involved either Japan, India, or Canada.
Table 3: APAs Revoked or Cancelled and Applications Withdrawn § 521(b)(2)(C)(vii)67
| Unilateral | Bilateral | Multilateral | Total | |
|---|---|---|---|---|
| Revoked or Cancelled in 2020 | 0 | 0 | 0 | 0 |
| Total Revoked or Cancelled 1991-20206 | 11 | |||
| Applications Withdrawn in 2020 | 2 | 5 | 0 | 7 |
| Total Applications Withdrawn 1991-20207 | 272 |
Table 4: APAs Executed in 2020 by Industry § 521(b)(2)(C)(viii)
| Industry | |
|---|---|
| Manufacturing | 43 |
| Wholesale/Retail Trade | 40 |
| Services | 22 |
| Finance, Insurance, and Real Estate | 11 |
| Management | 9 |
| All Other Industries | 2 |
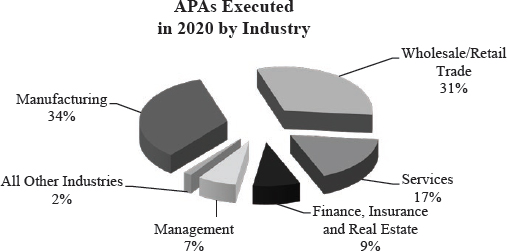
Table 4a: Manufacturing APAs Executed in 2020
| Manufacturing | |
|---|---|
| Chemical Manufacturing | 8 |
| Transportation Equipment Manufacturing | 8 |
| Miscellaneous Manufacturing | 7 |
| Food Manufacturing | 6 |
| Computer and Electronic Product Manufacturing | 5 |
| Machinery Manufacturing | 3 |
| Plastics and Rubber Products Manufacturing | 3 |
| All Other Manufacturing | 3 |
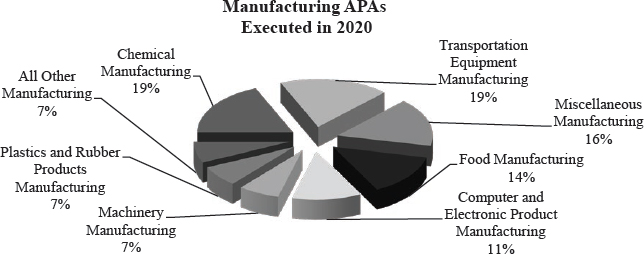
Table 4b: Wholesale/Retail Trade APAs Executed in 2020
| Wholesale/Retail Trade | |
|---|---|
| Merchant Wholesalers, Durable Goods | 24 |
| Merchant Wholesalers, Nondurable Goods | 8 |
| Electronics and Appliance Stores | 5 |
| All Other Wholesalers | 3 |
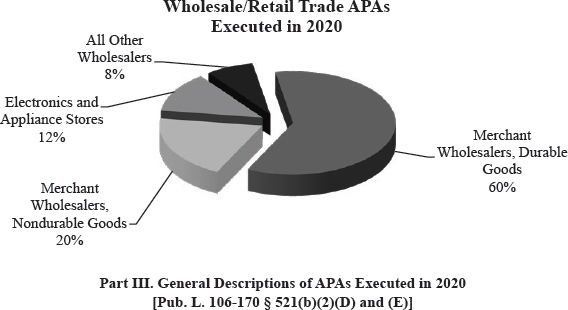
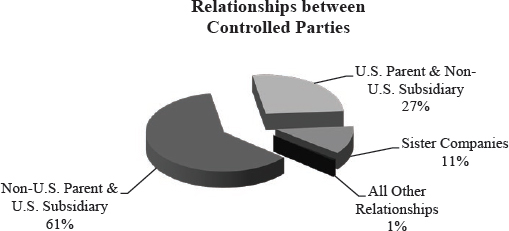
As in prior years, more than half of the APAs executed in 2020 involved transactions between non-U.S. parents and U.S. subsidiaries.
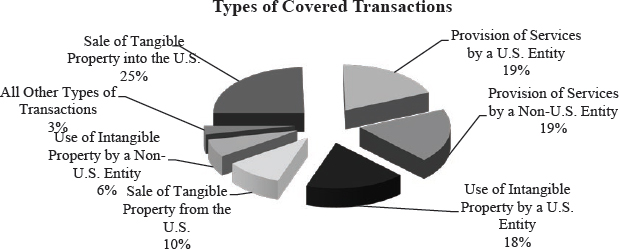
Although most of the transactions8 covered in APAs executed in 2020 involve the sale of tangible goods or the provision of services, approximately 25 percent of transactions covered in APAs executed in 2020 involve the use of intangible property, which can be among the most challenging transactions in APMA’s inventory.
In the majority of APAs, the covered transactions involve numerous business functions and risks. For instance, with respect to functions, APAs involving manufactured products typically involve a controlled group that conducts research and development (R&D), engages in product design and engineering, manufactures the product, markets and distributes the product, and performs support functions such as legal, finance, and human resources. Regarding risks, the controlled group may assume a variety of risks, including market risks, R&D risks, financial risks, credit and collection risks, product liability risks, and general business risks. In the APA evaluation process, a significant amount of time and effort is devoted to understanding how the functions and risks are allocated amongst the controlled group of companies that are party to the covered transactions. For methods requiring selection of a tested party, the tested party that is chosen generally will be the least complex of the controlled taxpayers.
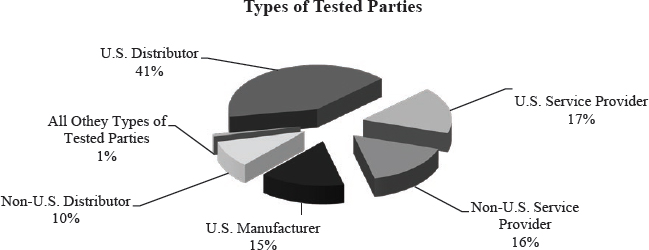
Consistent with prior years, a majority of tested parties9 in 2020 were U.S. distributors, U.S. manufacturers, or U.S. service providers.
In 2020, the most commonly used transfer pricing method (TPM) for both the sale of tangible property and the use of intangible property continued to be the comparable profits method/transactional net margin method (CPM/TNMM). The CPM/TNMM was used for 84 percent of transfers of tangible and intangible property.
For covered transfers of tangible and intangible property that used the CPM/TNMM, the operating margin (OM) is still the most common profit level indicator (PLI) used to benchmark results. It was used 69 percent of the time. Other PLIs, such as the Berry Ratio and net cost plus, made up the other 31 percent. As used here, “OM” is defined as the ratio of operating profit to sales,10 and “Berry Ratio” is defined as the ratio of gross profit to operating expenses.11 Most services transactions (85 percent) also used the CPM/TNMM with the OM and operating profit to operating expense being the most common PLIs (used 57 percent of the time).12
For the APAs executed in 2020 that involved CPM/TNMM with a North American tested party, the most widely used data source for comparables was Standard and Poor’s Compustat/Capital IQ database. Different sources were used in other cases (e.g., where the tested party was not a U.S. or Canadian entity or where transaction-based methods were applied). The other most commonly used databases are listed in the table below.
Table 5: Sources of Comparable Data
| Avention (formerly known as OneSource) | Mergent |
| Bloomberg | Orbis |
| Bureau van Dijk (BvD) | Prowess |
| Global Vantage | RoyaltySource |
| ktMINE | RoyaltyStat |
| LoanConnector | Worldscope |
In making comparability adjustments, typical balance sheet adjustments, as identified in Treas. Reg. §§ 1.482-1(d)(2) and 1.482-5(c)(2)(iv), were made in most cases, including adjustments for differing amounts of payables, receivables, and inventory. Where appropriate, adjustments for different accounting practices were made to convert from LIFO to FIFO inventory accounting, and a small number of cases also involved the accounting reclassification of expenses, e.g., from COGS to operating expenses.
Most transactions covered in APAs target an interquartile range as described in Treas. Reg. § 1.482-1(e)(2)(iii)(C). Where the transaction involves a royalty payment for the use of intangible property, both specific royalty rates and ranges have been used. Where the covered transaction is the sale or license of intangible property, and the payment for such transfer would be a royalty based solely on external comparable uncontrolled transactions, a secondary or confirming method, e.g., a test of the post-royalty operating margin or cost-plus mark-up, has sometimes also been used. The testing periods of the APAs executed in 2020 were either a single year, the term of the APA only, or the term of the APA plus rollback years.
APAs executed in 2020 included several mechanisms for making adjustments to the tested party results when the results fall outside the range or do not match the point required by the APA. Examples of the mechanisms used are an adjustment bringing the tested party’s results to the closer edge of the range applied to the results of a single year, an adjustment to the closer edge of the range applied to the results over the APA term, an adjustment to the specified point or royalty rate, or an adjustment to the median of the range for a single year.
The model APAs used by the IRS (included as Appendix 1 of this report) include standard critical assumptions that there will be no material changes to the taxpayer’s business or to its tax or financial accounting practices during the APA term. A few bilateral cases have also included critical assumptions tied to the taxpayer’s profitability in a certain year or over the term of the APA. Pursuant to § 7.06(3) of Rev. Proc. 2015-41, APMA will cancel an APA in the event of a failure of a critical assumption unless the parties agree to revise the APA.
Table 6: Term Lengths of APAs Executed in 2020
| Term Length (years) | Number of APAs |
|---|---|
| 1 | 1 |
| 2 | 2 |
| 3 | 3 |
| 4 | 4 |
| 5 | 62 |
| 6 | 15 |
| 7 | 24 |
| 8 | 11 |
| 9 | 4 |
| 14 | 1 |
| Average | 6 |
As described in § 3.03(1) of Rev. Proc. 2015-41, taxpayers should request an APA term that would cover at least five prospective years and may also request that the APA be “rolled back” to cover one or more earlier taxable years, although the appropriate APA term is decided on a case-by-case basis. Of the APAs executed in 2020, 11 percent included rollback years. A substantial number of those APAs with terms of greater than five years were submitted as a request for a five-year term, and the additional years were agreed to between the taxpayer and the IRS (or, in the case of a bilateral APA, between the IRS and the foreign government upon the taxpayer’s request) to ensure a reasonable amount of prospectivity in the APA term.
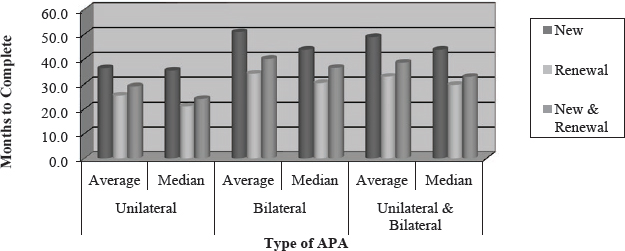
The median time required to complete an APA continued to decrease in 2020 to 32.7 months (from 38.8 months in 2019 and 40.2 months in 2018).
As described in § 7.02(1) of Rev. Proc. 2015-41, taxpayers are required to file annual reports to demonstrate compliance with the terms and conditions of their APAs. The filing and review of these annual reports are critical parts of the APA process. Through annual report review, the APMA Program monitors taxpayer compliance with APAs on a contemporaneous basis. Annual report review also provides current information on the success or problems associated with the various TPMs adopted in the APA process.
APAs require taxpayers to file timely and complete annual reports describing their operations and demonstrating compliance with the APA’s terms and conditions. Not every annual report will include each of the items listed in the following table 13; they are required where the facts demonstrate a need for such documentation.
| 1. | Statement regarding all material differences between Taxpayer’s business operations during APA year and description of Taxpayer’s business operations contained in Taxpayer’s APA request. If there are no material differences, a statement to that effect. |
| 2. | Statement concerning all material changes in Taxpayer’s accounting methods and classifications, and methods of estimation, from those described or used in Taxpayer’s request for the APA. If there has been no material change in accounting methods and classifications or methods of estimation, a statement to that effect. |
| 3. | Any change to the Taxpayer notice information. |
| 4. | Description of any failure to meet critical assumptions. If there has been none, a statement to that effect. |
| 5. | Statement identifying whether any material information submitted while the APA request was pending is discovered to be false, incorrect, or incomplete. |
| 6 | The amount, reason for, and financial analysis of any compensating adjustment, for the APA year, including but not limited to the amounts paid or received by each affected entity; the character (such as capital or ordinary expense) and country source of the funds transferred, and the specific line item(s) of any affected U.S. tax return; and any change to any entity classification for federal income tax purposes of any member of Taxpayer’s group that is relevant to the APA. |
| 7. | The amounts, description, reason for, and financial analysis of any book-tax difference relevant to the TPM for the APA year, as reflected on Schedule M-1 or Schedule M-3 of the U.S. return for the APA year. |
| 8. | Statement regarding whether Taxpayer contemplates requesting, or has requested, to renew, modify, or cancel the APA. |
| 9. | Financial statements and any necessary account detail to show compliance with the TPM, with a copy of the opinion from an independent certified public accountant or other documentation required by paragraph 5(f) of the APA. |
| 10. | Financial analysis demonstrating Taxpayer’s compliance with TPM. |
| 11. | Organizational chart. |
| 12. | A copy of the APA and any amendment. |
| 13. | A penalty of perjury statement. |
ADVANCE PRICING AGREEMENT
between
[Insert Taxpayer’s Name]
and
THE INTERNAL REVENUE SERVICE
The Parties to this Advance Pricing Agreement (APA) are the Internal Revenue Service (IRS) and [Insert Taxpayer’s Name], EIN ________.
[Insert Taxpayer Name] is the common parent of an affiliated group filing consolidated U.S. tax returns (collectively referred to as “Taxpayer”), and is entering into this APA on behalf of itself and other members of its consolidated group.
Taxpayer’s principal place of business is [City, State]. [Insert general description of taxpayer and other relevant parties].
This APA contains the Parties’ agreement on the best method for determining arm’s-length prices of the Covered Transactions under I.R.C. section 482, the Treasury Regulations thereunder, and any applicable tax treaties.
{If renewal, add} [Taxpayer and IRS previously entered into an APA covering taxable years ending _____ to ______, executed on ________.]
The Parties agree as follows:
1. Covered Transactions. This APA applies to the Covered Transactions, as defined in Appendix A.
2. Transfer Pricing Method. Appendix A sets forth the Transfer Pricing Method (TPM) for the Covered Transactions.
3. Term. This APA applies to the APA Term, as defined in Appendix A.
4. Operation.
a. Revenue Procedure 2006-9 governs the interpretation, legal effect, and administration of this APA.
b. Nonfactual oral and written representations, within the meaning of sections 10.04 and 10.05 of Revenue Procedure 2006-9 (including any proposals to use particular TPMs), made in conjunction with the APA Request constitute statements made in compromise negotiations within the meaning of Rule 408 of the Federal Rules of Evidence.
5. Compliance.
a. Taxpayer must report its taxable income in an amount that is consistent with Appendix A and all other requirements of this APA on its timely filed U.S. Return. However, if Taxpayer’s timely filed U.S. Return for any taxable year covered by this APA (APA Year) is filed prior to, or no later than 60 days after, the effective date of this APA, then Taxpayer must report its taxable income for that APA Year in an amount that is consistent with Appendix A and all other requirements of this APA either on the original U.S. Return or on an amended U.S. Return filed no later than 120 days after the effective date of this APA, or through such other means as may be specified herein.
b. {Use or edit the following when U.S. Group or Foreign Group contains more than one member.} [This APA addresses the arm’s-length nature of prices charged or received in the aggregate between Taxpayer and Foreign Participants with respect to the Covered Transactions. Except as explicitly provided, this APA does not address and does not bind the IRS with respect to prices charged or received, or the relative amounts of income or loss realized, by particular legal entities that are members of U.S. Group or that are members of Foreign Group.]
c. For each APA Year, if Taxpayer complies with the terms and conditions of this APA, then the IRS will not make or propose any allocation or adjustment under I.R.C. section 482 to the amounts charged in the aggregate between Taxpayer and Foreign Participant[s] with respect to the Covered Transactions.
d. If Taxpayer does not comply with the terms and conditions of this APA, then the IRS may:
i. enforce the terms and conditions of this APA and make or propose allocations or adjustments under I.R.C. section 482 consistent with this APA;
ii. cancel or revoke this APA under section 11.06 of Revenue Procedure 2006-9; or
iii. revise this APA, if the Parties agree.
e. Taxpayer must timely file an Annual Report (an original and four copies) for each APA Year in accordance with Appendix C and section 11.01 of Revenue Procedure 2006-9. Taxpayer must file the Annual Report for all APA Years through the APA Year ending [insert year] by [insert date]. Taxpayer must file the Annual Report for each subsequent APA Year by [insert month and day] immediately following the close of that APA Year. (If any date falls on a weekend or holiday, the Annual Report shall be due on the next date that is not a weekend or holiday.) The IRS may request additional information reasonably necessary to clarify or complete the Annual Report. Taxpayer will provide such requested information within 30 days. Additional time may be allowed for good cause.
f. The IRS will determine whether Taxpayer has complied with this APA based on Taxpayer’s U.S. Returns, the Financial Statements, and other APA Records, for the APA Term and any other year necessary to verify compliance. For Taxpayer to comply with this APA, {use the following or an alternative} an independent certified public accountant must render an opinion that Taxpayer’s Financial Statements present fairly, in all material respects, Taxpayer’s financial position under U.S. GAAP.
g. In accordance with section 11.04 of Revenue Procedure 2006-9, Taxpayer will (1) maintain the APA Records, and (2) make them available to the IRS in connection with an examination under section 11.03. Compliance with this subparagraph constitutes compliance with the record-maintenance provisions of I.R.C. sections 6038A and 6038C for the Covered Transactions for any taxable year during the APA Term.
h. The True Taxable Income within the meaning of Treasury Regulations sections 1.482-1(a)(1) and (i)(9) of a member of an affiliated group filing a U.S. consolidated return will be determined under the I.R.C. section 1502 Treasury Regulations.
i. {Optional for US Parent Signatories} To the extent that Taxpayer’s compliance with this APA depends on certain acts of Foreign Group members, Taxpayer will ensure that each Foreign Group member will perform such acts.
6. Critical Assumptions. This APA’s critical assumptions, within the meaning of Revenue Procedure 2006-9, section 4.05, appear in Appendix B. If any critical assumption has not been met, then Revenue Procedure 2006-9, section 11.06, governs.
7. Disclosure. This APA, and any background information related to this APA or the APA Request, are: (1) considered “return information” under I.R.C. section 6103(b)(2)(C); and (2) not subject to public inspection as a “written determination” under I.R.C. section 6110(b)(1). Section 521(b) of Pub. L. 106-170 provides that the Secretary of the Treasury must prepare a report for public disclosure that includes certain specifically designated information concerning all APAs, including this APA, in a form that does not reveal taxpayers’ identities, trade secrets, and proprietary or confidential business or financial information.
8. Disputes. If a dispute arises concerning the interpretation of this APA, the Parties will seek a resolution by the Director of the Advance Pricing and Mutual Agreement Program, to the extent reasonably practicable, before seeking alternative remedies.
9. Materiality. In this APA the terms “material” and “materially” will be interpreted consistently with the definition of “material facts” in Revenue Procedure 2006-9, section 11.06(4).
10. Section Captions. This APA’s section captions, which appear in italics, are for convenience and reference only. The captions do not affect in any way the interpretation or application of this APA.
11. Terms and Definitions. Unless otherwise specified, terms in the plural include the singular and vice versa. Appendix D contains definitions for capitalized terms not elsewhere defined in this APA.
12. Entire Agreement and Severability. This APA is the complete statement of the Parties’ agreement. The Parties will sever, delete, or reform any invalid or unenforceable provision in this APA to approximate the Parties’ intent as nearly as possible.
13. Successor in Interest. This APA binds, and inures to the benefit of, any successor in interest to Taxpayer.
14. Notice. Any notices required by this APA or Revenue Procedure 2006-9 must be in writing. Taxpayer will send notices to the IRS at the address and in the manner set forth in Revenue Procedure 2006-9, section 4.11. The IRS will send notices to:
|
Taxpayer Corporation Attn: Jane Doe, Sr. Vice President (Taxes) 1000 Any Road Any City, USA 10000 (phone: _________) |
15. Effective Date and Counterparts. This APA is effective starting on the date, or later date of the dates, upon which all Parties execute this APA. The Parties may execute this APA in counterparts, with each counterpart constituting an original.
WITNESS,
The Parties have executed this APA on the dates below.
[Taxpayer Name in all caps]
By: ___________________________ Date: ___________________, 201___
Jane Doe
Sr. Vice President (Taxes)
IRS
By: ___________________________ Date: ___________________, 201___
John C. C. Hughes
Director, Advance Pricing and Mutual Agreement Program
COVERED TRANSACTIONS AND TRANSFER PRICING METHOD (TPM)
1. Covered Transactions.
[Define the Covered Transactions.]
2. APA Term.
This APA applies to Taxpayer’s taxable years ending __________ through ________ (APA Term).
3. TPM.
{Note: If appropriate, adapt language from the following examples.}
[The Tested Party is __________.]
• CUP Method
The TPM is the comparable uncontrolled price (CUP) method. The Arm’s Length Range of the price charged for _________ is between _______ and ___________ per unit.
• CUT Method
The TPM is the CUT Method. The Arm’s Length Range of the royalty charged for the license of ______is between ____% and ___ % of [Taxpayer’s, Foreign Participants’, or other specified party’s] Net Sales Revenue. [Insert definition of net sales revenue or other royalty base.]
• Resale Price Method (RPM)
The TPM is the resale price method (RPM). The Tested Party’s Gross Margin for any APA Year is defined as follows: the Tested Party’s gross profit divided by its sales revenue (as those terms are defined in Treasury Regulations sections 1.482-5(d)(1) and (2)) for that APA Year. The Arm’s Length Range is between ____% and ___ %, and the Median of the Arm’s Length Range is ___%.
• Cost Plus Method
The TPM is the cost plus method. The Tested Party’s Cost Plus Markup is defined as follows for any APA Year: the Tested Party’s ratio of gross profit to production costs (as those terms are defined in Treasury Regulations sections 1.482-3(d)(1) and (2)) for that APA Year. The Arm’s Length Range is between ___% and ___%, and the Median of the Arm’s Length Range is ___%.
• CPM with Berry Ratio PLI
The TPM is the comparable profits method (CPM). The profit level indicator is a Berry Ratio. The Tested Party’s Berry Ratio is defined as follows for any APA Year: the Tested Party’s gross profit divided by its operating expenses (as those terms are defined in Treasury Regulations sections 1.482-5(d)(2) and (3)) for that APA Year. The Arm’s Length Range is between ____ and ___, and the Median of the Arm’s Length Range is ___.
• CPM using an Operating Margin PLI
The TPM is the comparable profits method (CPM). The profit level indicator is an operating margin. The Tested Party’s Operating Margin is defined as follows for any APA Year: the Tested Party’s operating profit divided by its sales revenue (as those terms are defined in Treasury Regulations section 1.482-5(d)(1) and (4)) for that APA Year. The Arm’s Length Range is between ____% and ___ %, and the Median of the Arm’s Length Range is ___%.
• CPM using a Three-year Rolling Average Operating Margin PLI
The TPM is the comparable profits method (CPM). The profit level indicator is an operating margin. The Tested Party’s Three-Year Rolling Average operating margin is defined as follows for any APA Year: the sum of the Tested Party’s operating profit (within the meaning of Treasury Regulation section 1.482-5(d)(4) for that APA Year and the two preceding years, divided by the sum of its sales revenue (within the meaning of Treasury Regulation section 1.482-5(d)(1)) for that APA Year and the two preceding years. The Arm’s Length Range is between ____% and ____%, and the Median of the Arm’s Length Range is ___%.
• Residual Profit Split Method
The TPM is the residual profit split method. [Insert description of routine profit level determinations and residual profit-split mechanism].
[Insert additional provisions as needed.]
4. Application of TPM.
For any APA Year, if the results of Taxpayer’s actual transactions produce a [price per unit, royalty rate for the Covered Transactions] [or] [Gross Margin, Cost Plus Markup, Berry Ratio, Operating Margin, Three-Year Rolling Average Operating Margin for the Tested Party] within the Arm’s Length Range, then the amounts reported on Taxpayer’s U.S. Return must clearly reflect such results.
For any APA year, if the results of Taxpayer’s actual transactions produce a [price per unit, royalty rate] [or] [Gross Margin, Cost Plus Markup, Berry Ratio, Operating Margin, Three-Year Rolling Average Operating Margin for the Tested Party] outside the Arm’s Length Range, then amounts reported on Taxpayer’s U.S. Return must clearly reflect an adjustment that brings the [price per unit, royalty rate] [or] [Tested Party’s Gross Margin, Cost Plus Markup, Berry Ratio, Operating Margin, Three-Year Rolling Average Operating Margin] to the Median.
For purposes of this Appendix A, the “results of Taxpayer’s actual transactions” means the results reflected in Taxpayer’s and Tested Party’s books and records as computed under U.S. GAAP [insert another relevant accounting standard if applicable], with the following adjustments:
(a) [The fair value of stock-based compensation as disclosed in the Tested Party’s audited financial statements shall be treated as an operating expense]; and
(b) To the extent that the results in any prior APA Year are relevant (for example, to compute a multi-year average), such results shall be adjusted to reflect the amount of any adjustment made for that prior APA Year under this Appendix A.
5. APA Revenue Procedure Treatment
If Taxpayer makes an adjustment under paragraph 4 of this Appendix A (a “primary adjustment”), Taxpayer and its related foreign entity may elect APA Revenue Procedure Treatment in accordance with section 11.02(3) of Revenue Procedure 2006-9 and avoid the possible adverse tax consequences of a secondary adjustment that would otherwise follow the primary adjustment.
[Insert additional provisions as needed.]
CRITICAL ASSUMPTIONS
This APA’s critical assumptions are:
1. The business activities, functions performed, risks assumed, assets employed, and financial and tax accounting methods and classifications [and methods of estimation] of Taxpayer in relation to the Covered Transactions will remain materially the same as described or used in Taxpayer’s APA Request. A mere change in business results will not be a material change.
[Insert additional provisions as needed.]
APA RECORDS AND ANNUAL REPORT
The APA Records will consist of all documents listed below for inclusion in the Annual Report, as well as all documents, notes, work papers, records, or other writings that support the information provided in such documents.
The Annual Report (and each of the four copies required by paragraph 5(e) of this APA) will include:
1. Two copies of a properly completed APA Annual Report Summary in the form of Appendix E to this APA, one copy of the form bound with, and one copy provided separately from, the rest of the Annual Report.
2. A table of contents, organized as follows:
3. Statements that fully identify, describe, analyze, and explain:
a. All material differences between the U.S. Group’s business operations (including functions, risks assumed, markets, contractual terms, economic conditions, property, services, and assets employed) during the APA Year from the business operations described in the APA Request. If there have been no material differences, the Annual Report will include a statement to that effect.
b. All material differences between the U.S. Group’s accounting methods and classifications, and methods of estimation used during the APA Year, from those described or used in the APA Request. If any change was made to conform to changes in U.S. GAAP (or other relevant accounting standards) Taxpayer will specifically identify the change. If there has been no material change in accounting methods and classifications or methods of estimation, the Annual Report will include a statement to that effect.
c. Any change to the Taxpayer notice information in paragraph 14 of this APA.
d. Any failure to meet any critical assumption. If there has been no failure, the Annual Report will include a statement to that effect.
e. Whether or not material information submitted while the APA Request was pending is discovered to be false, incorrect, or incomplete.
f. Any change to any entity classification for federal income tax purposes (including any change that causes an entity to be disregarded for federal income tax purposes) of any Worldwide Group member that is a party to the Covered Transactions or is otherwise relevant to the TPM.
g. The amount, reason for, and financial analysis of (1) any primary adjustments made under Appendix A for the APA Year; and (2) any (a) secondary adjustments that follow such primary adjustments or (b) accounts receivable that Taxpayer establishes, in lieu of secondary adjustments, by electing APA Revenue Procedure Treatment pursuant to paragraph 5 of Appendix A and Revenue Procedure 2006-9, section 11.02(3), for the APA Year, including but not limited to:
i. the amounts due or owed, and paid or received by each affected entity;
ii. the character (such as capital, ordinary, income, expense) and country source of the funds transferred, and the specific affected line item(s) of any affected U.S. Return;
iii. the date(s) and means by which the payments are or will be made; and
iv. whether or not APA Revenue Procedure Treatment was elected pursuant to paragraph 5 of Appendix A and Revenue Procedure 2006-9, section 11.02(3).
h. The amounts, description, reason for, and financial analysis of any book-tax difference relevant to the TPM for the APA Year, as reflected on Schedule M-1 or Schedule M-3 of the U.S. Return for the APA Year.
i. Whether Taxpayer contemplates requesting, or has requested, to renew, modify, or cancel the APA.
4. The Financial Statements, and any necessary account detail to show compliance with the TPM, including consolidating financial statements, segmented financial data, records from the general ledger, or similar information if the assets, liabilities, income, or expenses relevant to showing compliance with the TPM are a subset of the assets, liabilities, income, or expenses presented in the Financial Statements.
5. {Use the following or the alternative prescribed by paragraph 5(f) of this APA:} A copy of the independent certified public accountant’s opinion required by paragraph 5(f) of this APA.
6. A financial analysis that reflects Taxpayer’s TPM calculations for the APA Year. The calculations must reconcile with and reference the information required under item 4 above in sufficient account detail to allow the IRS to determine whether Taxpayer has complied with the TPM.
7. An organizational chart for the Worldwide Group, revised annually to reflect all ownership or structural changes of entities that are parties to the Covered Transactions or are otherwise relevant to the TPM.
8. A copy of the APA and any amendment.
9. A penalty of perjury statement, executed in accordance with Revenue Procedure 2006-9, section 11.01(6) and (7).
DEFINITIONS
The following definitions control for all purposes of this APA. The definitions appear alphabetically below:
| Term | Definition |
|---|---|
| Annual Report | A report within the meaning of Revenue Procedure 2006-9, section 11.01. |
| APA | This Advance Pricing Agreement, which is an “advance pricing agreement” within the meaning of Revenue Procedure 2006-9, section 2.04. |
| APA Records | The records specified in Appendix C. |
| APA Request | Taxpayer’s request for this APA dated _________, including any amendments or supplemental or additional information thereto. |
| APA Year | This term is defined in paragraph 5(a) of this APA. |
| Covered Transaction(s) | This term is defined in Appendix A. |
| Financial Statements | Financial statements prepared in accordance with U.S. GAAP and stated in U.S. dollars. |
| Foreign Group | Worldwide Group members that are not U.S. persons. |
| Foreign Participants | [name the foreign entities involved in Covered Transactions]. |
| I.R.C. | The Internal Revenue Code of 1986, 26 U.S.C., as amended. |
| Pub. L. 106-170 | The Ticket to Work and Work Incentives Improvement Act of 1999. |
| Revenue Procedure 2006-9 | Rev. Proc. 2006-9, 2006-1 C.B. 278. |
| Transfer Pricing Method (TPM) | A transfer pricing method within the meaning of Treasury Regulation section 1.482-1(b) and Revenue Procedure 2006-9, section 2.04. |
| U.S. GAAP | U.S. generally-accepted accounting principles. |
| U.S. Group | Worldwide Group members that are U.S. persons. |
| U.S. Return | For each taxable year, the “returns with respect to income taxes under subtitle A” that Taxpayer must “make” in accordance with I.R.C. section 6012. {Or substitute for partnership: For each taxable year, the “return” that Taxpayer must “make” in accordance with I.R.C. section 6031.} |
| Worldwide Group | Taxpayer and all organizations, trades, businesses, entities, or branches (whether or not incorporated, organized in the United States, or affiliated) owned or controlled directly or indirectly by the same interests. |
APA ANNUAL REPORT SUMMARY FORM
The APA Annual Report Summary on the next page is a required APA Record. The APA Team Leader supplies some of the information requested on the form. Taxpayer is to supply the remaining information requested by the form and submit the form as part of its Annual Report.
|
APA Annual Report SUMMARY |
Department of the Treasury-Internal Revenue Service Large Business and International Division Treaty and Transfer Pricing Operations Advance Pricing and Mutual Agreement Program |
APA No. _______________ Team Leader _______________________ Economist _______________________________ Intl Examiner _____________________________ |
|
APA Information |
Taxpayer Name: ___________________________________________________ Taxpayer EIN:_________________ NAICS:___________________ APA Term: Taxable years ending ________ to ____________ Original APA [ ] Renewal APA [ ] Annual Report due dates: _________________, 201__ for all APA Years through APA Year ending in 200__; for each APA Year thereafter, on _________________ [month and day] immediately following the close of the APA Year Principal foreign country(ies) involved in covered transaction(s): _______________________________________ Type of APA: [ ] unilateral [ ] bilateral with ________________ Tested party is [ ] US [ ] foreign [ ] both Approximate dollar volume of covered transactions (on an annual basis) involving tangible goods and services: [ ] N/A [ ] <$50 million [ ] $50-100 million [ ] $100-250 million [ ] $250-500 million [ ] >$500 million APA tests on (check all that apply): [ ] annual basis [ ] multi-year basis [ ] term basis APA provides (check all that apply) a: [ ] range [ ] point [ ] floor only [ ] ceiling only [ ] other_____________ APA provides for adjustment (check all that apply) to: [ ] nearest edge [ ] median [ ] other point |
|
|
APA Annual Report Information (to be completed by the Taxpayer) |
APA date executed: ______________, 201__ This APA Annual Report Summary is for APA Year(s) ending in 200__ and was filed on _____________, 201__ Check here [ ] if Annual Report was filed after original due date but in accordance with extension. Has this APA been amended or changed? [ ] yes [ ] no Effective Date: ______________________ Has Taxpayer complied with all APA terms and conditions? [ ] yes [ ] no Were all the critical assumptions met? [ ] yes [ ] no Has a Primary Compensating Adjustment been made in any APA Year covered by this Annual Report? [ ] yes [ ] no If yes, which year(s): 200___ Have any necessary Secondary Compensating Adjustments been made? [ ] yes [ ] no Did Taxpayer elect APA Revenue Procedure treatment? [ ] yes [ ] no Any change to the entity classification of a party to the APA? [ ] yes [ ] no Taxpayer notice information contained in the APA remains unchanged? [ ] yes [ ] no Taxpayer's current US principal place of business: (City, State) _____________________________________ |
|
| APA Annual Report | Financial analysis reflecting TPM calculations | [ ] yes [ ] no |
| Checklist of | Financial statements showing compliance with TPM(s) | [ ] yes [ ] no |
| Key Contents | Schedule M-1 or M-3 book-tax differences | [ ] yes [ ] no |
| (to be completed | Current organizational chart of relevant portion of world-wide group | [ ] yes [ ] no |
| by the Taxpayer) | Attach copy of APA | [ ] yes [ ] no |
| Other APA records and documents included: | ||
|
Contact Information |
Authorized Representative Phone Number | Affiliation and Address |
TEMPLATE FOR ADVANCE PRICING AGREEMENT UNDER REVENUE PROCEDURE 2015-41
_______________
The Advance Pricing and Mutual Agreement Program (“APMA”) of the Internal Revenue Service (“IRS”) is providing this template for use in drafting advance pricing agreements (“APAs”) issued under IRS Revenue Procedure 2015-41, 2015-35 I.R.B. 263 (“Rev. Proc. 2015-41”). This template is designed to systematize how taxpayers propose terms for their APAs and standardize language used in executed APAs. It will improve efficiency in the APA process and enhance consistency in the administration of the APA program.
Rev. Proc. 2015-41 requires that taxpayers include as part of a complete APA request a draft APA and a “redline” comparison of the proposed draft APA against the current model APA. See section 2.03, exhibit 15, of the Appendix to Rev. Proc. 2015-41. This template serves as the model APA. A taxpayer is required to produce the “redline” comparison by following the instructions below to edit this template with tracked changes. The draft APA and “redline” comparison are then to be included in Word format in the complete APA request. (Before editing the template with tracked changes, a taxpayer should remove this introduction and the instructions below from the Microsoft Word file.)
The assigned APMA team will review the APA’s terms proposed in the draft APA. If the APMA team accepts the proposed terms in light of its review of the taxpayer’s complete APA request and other information obtained during the APA process, then the text of the draft APA, edited as needed to fill in any information not available at the time of the APA Request, will be adopted as the text of a finally executed APA. If the APMA team does not accept the proposed terms, it will discuss modifications to the draft APA with the taxpayer during the APA process. For bilateral and multilateral APAs, the terms of the executed APA will of necessity be consistent with the terms of the underlying mutual agreement between the United States and one or more treaty partners.
The template is designed to minimize editing by using an options-based format for selecting from terms presented in certain sections of the model APA. The options presented are those which APMA considers standard and which it has accepted in final APAs. These options are not binding on APMA, however. APMA reserves the right to modify the option selections, the specific option language used, or any other terms before executing an APA with the taxpayer.
Options are indicated by square brackets (“[]”). An “x” should be inserted between the brackets to indicate the selected option (“[x]”). Options that are not selected should not be deleted, but instead should be left in the text of the draft APA. The options to which APMA and the taxpayer ultimately agree for the final APA will be indicated by the presence or absence of an “x”. The term associated with the “x” will be given operative effect in the executed APA.
Certain options are flagged with an asterisk after the square brackets (“[]*”). To facilitate the APMA team’s subsequent review of the draft APA, the asterisks should not be deleted. Taxpayers that select flagged options are required to specifically provide justification for the selection in the APA request. See section 1.02, Part 5, of the Appendix to Rev. Proc. 2015-41.
The template contains placeholder phrases consisting of a hashtag followed by one or more words in block capital letters (e.g., “#COUNTRY”). Generally, the taxpayer should replace a placeholder phrase with appropriate text, subject to the following conventions:
-
If a placeholder phrase occurs within an option that the taxpayer has rejected, the taxpayer should change the hashtag to a caret (e.g., change “#COUNTRY” to “^COUNTRY”) but otherwise leave the phrase intact.14 The caret indicates that the Taxpayer has rejected this option. For example, for a bilateral APA with Japan, the lines on the first page just below the title would read:
[x] Bilateral with Japan [] Multilateral with COUNTRIES [] Unilateral
-
The placeholder phrase “#CURRENCY” should be replaced, for example, with “U.S. dollars,” “Euros,” or “Japanese yen.”
-
The placeholder phrase “#DATE” should be replaced with a date in the format of “December 31, 2020.”
The APA Term will be expressed as dates certain, e.g., “January 1, 2017 to December 31, 2022, inclusive”, rather than as particular tax years.
Taxpayers may need to draft custom text for situations or options not included in the template. For example, a taxpayer may propose additional critical assumptions to address specific regulatory contingencies or conditions the taxpayer is expected to face during the term of the APA. As another example, the provision titled “Limitation on Assistance” at the end of the Recitals might be modified based on an understanding reached in the prefiling stage of the APA process. In some cases, a particular critical assumption might facilitate reaching an agreement on an APA. Taxpayers that include custom text are required to specifically provide justification for the inclusion in the APA request, just as selecting an option with an asterisk requires justification. Any custom text must also be evident in the “redline” comparison of the proposed draft APA.
The template contains certain tables that the taxpayer should edit. Entries in the tables will not contain hashtags, but taxpayers nevertheless should fill in the information and add additional rows to the tables if needed. Taxpayers also should fill in the “APA Information” in the table in Appendix D, to the extent available or proposed.
Appendix A of this template contains the description of the APA’s covered issue(s) and covered method(s). Taxpayers should note the following points in completing Appendix A:
-
The template includes just one covered issue with one corresponding covered method. If there is more than one covered Issue proposed for the APA, the taxpayer should add additional covered issues in Appendix A, section 3, with tracked changes.
-
If there is more than one covered method, the taxpayer should first replicate the template’s entire text for Covered Method 1 in Appendix A, section 4, without tracked changes, to provide template text for each additional covered method, and then edit the text for each covered method with tracked changes.
-
Normally, each covered issue will have its own corresponding covered method. However, in some cases, a covered method may apply at once to more than one covered issue. For example, covered issues may be proposed to be aggregated and tested by a single covered method. In such cases, the heading for that covered method could read, for example, “Covered Method for Covered Issues 1-3”.
-
Any interaction between different covered methods should be adequately explained in the text, and in an appropriate manner. For example, an explanation might be provided in an introduction at the start of section 4 of Appendix A, preceding the description of the respective covered methods.
Appendix A uses the term “Tested Party.” When applied in the context of methods that consider, or test, data from only one party to a transaction, this term is similar in concept to the term “tested party” as discussed in the OECD Guidelines at paragraphs 3.18 and 3.19, and as defined in the U.S. Treasury Regulations section 1.482-5(b)(2). However, some methods consider, or test, data from both parties to a transaction, where there is no singular “tested” party. Even in applying such methods, however, it is typically the case that one particular party’s results are formally tested for compliance with the method. For purposes of this template, in such circumstances, the party whose results are formally tested in applying any particular method is the “Tested Party”, even if that party is not strictly a “tested party” as discussed in the OECD Guidelines paragraphs 3.18 and 3.19, or as defined in the U.S. Treasury Regulations section 1.482-5(b)(2).
ADVANCE PRICING AGREEMENT
between
#SIGNATORY
and
THE INTERNAL REVENUE SERVICE
[] Bilateral with #COUNTRY
[] Multilateral with #COUNTRIES
[] Unilateral
Term: #DATE to #DATE, inclusive
[] This APA is commonly referred to as #APA NAME.
PARTIES
The Parties to this APA are the Internal Revenue Service (“IRS”) and #NAME OF EACH NON-IRS SIGNATORY, WITH EIN.
[] #SIGNATORY will be referred to as “U.S. Taxpayer.”
[] #SIGNATORY is the common parent of an affiliated group filing consolidated U.S. tax returns and is entering into this APA on behalf of both itself and the following members of its consolidated group: #MEMBERS OF GROUP. All members of this consolidated group will be referred to collectively as “U.S. Taxpayer.”
RECITALS
[] This APA is a renewal of one or more prior APAs, which are listed below in reverse chronological order:
Key:
-
Party(ies): The signatory(ies) to the prior APA, other than the IRS, with each signatory’s taxpayer identification number;
-
Execution Date: The date, or the later of the dates, on which the prior APA was executed;
-
Term: The term of the prior APA.
[] This is a bilateral APA within the meaning of Rev. Proc. 2015-41 and implements the terms of a mutual agreement reached between the United States and #COUNTRY.
[] This is a multilateral APA within the meaning of Rev. Proc. 2015-41 and implements the terms of a mutual agreement reached among the United States, #COUNTRIES.
[] This APA is a unilateral APA within the meaning of Rev. Proc. 2015-41 and is not based on any mutual agreement.
The Parties to this APA are defined in the ”Parties” section above. Regarding the Party(ies) to this APA other than the IRS:
[] No such Party has an immediate parent or owner that is not a U.S. entity.
[] One or more such Parties has an immediate parent or owner that is not a U.S. entity, as follows:
Key:
-
Party: Name of the Party having an immediate parent or owner that is not a U.S. entity;
-
Parent’s or Owner’s Identifying Information: Name of the immediate parent or owner of such Party, and the taxpayer identification number of that parent or owner for income tax purposes in its country of residence;
-
Parent’s or Owner’s Contact Information: The immediate parent’s or owner’s address and phone number.
The term “Worldwide Group” is defined below in paragraph 12 of this APA. The ultimate parent entity or owner of Worldwide Group is:
#ENTITY NAME, ADDRESS, AND PHONE
U.S. Taxpayer’s principal place of business is #CITY, #STATE. #BRIEF DESCRIPTION OF U.S. TAXPAYER AND NON-U.S. TAXPAYER (DEFINED IN SECTION 1 OF APPENDIX A), AND SPECIFICALLY OF EACH COVERED ENTITY (DEFINED IN SECTION 1 OF APPENDIX A).
This APA contains the Parties’ agreement on the Covered Method(s) for resolving the Covered Issue(s) under Code section 482 and any other Code sections that are identified in Appendix A to this APA, the U.S. Treasury Regulations thereunder, and (if applicable):
[] The income tax convention(s) between the United States and #COUNTRY(IES).
This APA shall not limit the authority of the IRS to (1) verify compliance with this APA as to the Covered Issue(s), or (2) audit issues other than Covered Issue(s), including issues that arise under Code section 482 and any other Code sections identified in Appendix A to this APA, and the U.S. Treasury Regulations thereunder.
LIMITATION ON ASSISTANCE
The Covered Issue(s) may relate to one or more countries which (i) have an income tax convention with the United States, but (ii) are not a party to a mutual agreement whose terms are implemented by this APA. U.S. Taxpayer acknowledges that the IRS may decline to provide competent authority assistance concerning taxation by such country(ies) that relates to the Covered Issue(s). See section 2.02(4)(d) of Rev. Proc. 2015-41.
AGREEMENT
The Parties agree as follows:
1. Covered Entities. This APA’s Covered Entities are defined in Appendix A.
2. Covered Issue(s). This APA applies to the Covered Issue(s), as defined in Appendix A.
3. Covered Method(s). Appendix A sets forth the Covered Method(s) for the Covered Issue(s).
4. Term. This APA applies to the APA Term, as defined in Appendix A.
5. Operation.
a. Rev. Proc. 2015-41 governs the interpretation, legal effect, and administration of this APA.
b. The APMA program provides a voluntary process whereby the IRS and taxpayers may resolve transfer pricing issues and issues for which transfer pricing principles may be relevant in a principled and cooperative manner on a prospective basis. As such, the APA process (as defined in Rev. Proc. 2015-41) is an alternative to dispute resolution that benefits both taxpayers and the IRS and that is intended to promote and encourage open communication. Accordingly, the IRS and U.S. Taxpayer agree that neither party will attempt to use nonfactual oral or written representations, within the meaning of sections 6.04 and 6.05 of IRS Revenue Procedure 2015-41 (including any proposals to use particular Covered Method(s)), made in conjunction with the APA Request in any judicial or administrative proceeding. The IRS and U.S. Taxpayer also agree that factual representations made in conjunction with the APA Request may be used in judicial and administrative proceedings.
6. Compliance.
a. U.S. Taxpayer must report its taxable income in an amount that is consistent with Appendix A and all other requirements of this APA. U.S. Taxpayer must so report its taxable income in the following manner:
i. For any APA Tax Year for which U.S. Taxpayer timely files its original U.S. return prior to, or no later than 60 days after, the U.S. Effective Date, U.S. Taxpayer must so report its taxable income for that APA Tax Year in one of the following ways:
A. on such original U.S. return;
B. on an amended U.S. return submitted no later than 120 days after the U.S. Effective Date;
C. through a means proposed by U.S. Taxpayer and accepted by the applicable IRS practice area no later than 120 days after the U.S. Effective Date (or by such other deadline as is agreed between U.S. Taxpayer and the applicable IRS practice area); or
D. if applicable:
[]* no later than 120 days after the U.S. Effective Date through the following means: #DESCRIPTION OF MEANS.
ii. For all other APA Tax Years, U.S. Taxpayer must so report its taxable income on its timely filed original U.S. return.
iii. The provisions of paragraphs 6(a)(i) and 6(a)(ii) are modified by this paragraph 6(a)(iii). If a Covered Method includes a term test (including the case of an annual test with a supplemental term test) or a subterm test, as described in section 4 of Appendix A, then the APA Covered Year as of which the term test or subterm test applies would change in the event of an Early Termination. Specifically, while in the absence of an Early Termination a term test would apply as of the last APA Covered Year, in the event of an Early Termination the term test would apply as of an earlier APA Covered Year. Similarly, while in the absence of an Early Termination a subterm test would apply as of the last APA Covered Year in the subterm, in the event of an Early Termination the subterm test might apply as of an earlier APA Covered Year. In these situations, the Early Termination might not be established in time for U.S. Taxpayer to know to apply the term test or subterm test as of the earlier APA Covered Year in reporting taxable income as required under paragraphs 6(a)(i) and 6(a)(ii) for the APA Tax Year corresponding to that earlier APA Covered Year. In such cases, U.S. Taxpayer may need to correct its reporting for that APA Tax Year. Specifically, U.S. Taxpayer will need to correct its income reporting for that APA Tax Year if the application of the term test or subterm test in that earlier APA Covered Year changes the existence or amount of an APA Primary Adjustment for the Covered Method for that APA Tax Year. In such cases:
A) The resulting incorrectness in the prior reporting for that APA Tax Year is excused; and
B) U.S. Taxpayer must correct such prior reporting through a means listed in paragraph 6(a)(i) within 120 days of the Early Termination being established.
b. For each Covered Issue, if any, that involves determination of pricing and/or income allocation15 under Code section 482 (or Code section 367(d)) as modified by any applicable income tax convention, this APA addresses the pricing and/or income allocation between U.S. Taxpayer and Non-U.S. Taxpayer in the aggregate. Except as explicitly provided, this APA does not address and does not bind the IRS with respect to pricing or income allocation (1) among particular legal entities that are members of U.S. Taxpayer, or (2) among particular legal entities that are members of Non-U.S. Taxpayer. In addition, this APA does not address pricing or income allocation between an entity that is not a Covered Entity, and any entity.
c. For each APA Tax Year, if U.S. Taxpayer complies with the terms and conditions of this APA, then, provided that this APA remains effective for that APA Tax Year for a particular Covered Issue, the IRS will not make or propose any allocation or adjustment that is inconsistent with the application under this APA of the applicable Covered Method to that Covered Issue.
d. If U.S. Taxpayer does not comply with the terms and conditions of this APA, then the IRS may:
i. enforce the terms and conditions of this APA and make or propose allocations or adjustments based on the application of the Covered Method(s) to the Covered Issue(s) as provided in this APA;
ii. cancel or revoke this APA under section 7.06 of Rev. Proc. 2015-41; or
iii. revise this APA, if the Parties agree.
e. U.S. Taxpayer must timely file an Annual Report for each APA Tax Year in accordance with this paragraph 6(e), Appendix C to this APA, and section 7.02 of Rev. Proc. 2015-41. Annual Reports for multiple APA Tax Years may be combined, provided that all required information for each APA Tax Year is clearly presented. For each Annual Report, U.S. Taxpayer must submit an original printed version containing a signed original “penalties of perjury” declaration, one printed copy of the contents of the original printed version, and an electronic copy of the contents of the original printed version. Any exhibits in the printed version must be tabbed, and the electronic copy is subject to the same requirements, as to medium and format, that are specified for APA requests in section 2 of the Appendix to Rev. Proc. 2015-41. Upon request, U.S. Taxpayer must provide additional copies of the printed version, at addresses specified by the IRS. U.S. Taxpayer must file the Annual Report for each APA Tax Year by the later of (i) #DATE CERTAIN, NORMALLY APPROXIMATELY 90 DAYS AFTER THE U.S. EFFECTIVE DATE, and (ii) the fifteenth day of the twelfth month following the close of the APA Tax Year. The IRS may by notice request additional information reasonably necessary to clarify or complete the Annual Report. (See paragraph 16, and section 3(c) of Appendix C, regarding notices.) U.S. Taxpayer will provide such requested information within 30 days from the date of the notice unless a later date is specified in the notice. Additional time may be allowed for good cause in the discretion of the Director of the Advance Pricing and Mutual Agreement Program.
f. The IRS will determine whether U.S. Taxpayer has complied with this APA based on U.S. Taxpayer’s U.S. returns, the Financial Statements and additional statements required under this paragraph 6(f), and other APA Records, for all APA Tax Years and any other tax year necessary to verify compliance. The Financial Statements and additional statements required for a particular tax year are:
[] For every U.S. Covered Entity, the Financial Statements together with the additional statements specified in paragraph 6(f)(i); and for every Non-U.S. Covered Entity, the Financial Statements together with the additional statements specified in paragraph 6(f)(ii).
[]* For every U.S. Covered Entity, the Financial Statements together with the additional statements specified in paragraph 6(f)(i).
[]* For every Non-U.S. Covered Entity, the Financial Statements together with the additional statements specified in paragraph 6(f)(ii).
i. For each U.S. Covered Entity, the additional statements consist of the following statement(s):
[] An audit opinion for that U.S. Covered Entity’s Financial Statements, as defined in paragraph 6(f)(iii).
[]* One or more of the following, as indicated:
[] An accountant’s report for that U.S. Covered Entity’s Financial Statements, as defined in paragraph 6(f)(iii).
[] A self-certification for that U.S. Covered Entity’s Financial Statements, as defined in paragraph 6(f)(iii).
[] A self-certification for that U.S. Covered Entity’s Financial Statements, together with a tying certification for that entity’s Financial Statements, as defined in paragraph 6(f)(iii).
[] #OTHER MEANS OF VERIFYING THE RELIABILITY OF THE U.S. COVERED ENTITY’S FINANCIAL STATEMENTS.
ii. For each Non-U.S. Covered Entity, the additional statements consist of the following statement(s):
[] An audit opinion for that Non-U.S. Covered Entity’s Financial Statements, as defined in paragraph 6(f)(iii).
[]* One or more of the following, as indicated:
[] An accountant’s report for that Non-U.S. Covered Entity’s Financial Statements, as defined in paragraph 6(f)(iii).
[] A self-certification for that Non-U.S. Covered Entity’s Financial Statements, as defined in paragraph 6(f)(iii).
[] A self-certification for that Non-U.S. Covered Entity’s Financial Statements, together with a tying certification for that Covered Entity’s Financial Statements, as defined in paragraph 6(f)(iii).
[] #OTHER MEANS OF VERIFYING THE RELIABILITY OF THE NON-U.S. COVERED ENTITY’S FINANCIAL STATEMENTS.
iii. With reference to the Financial Statements for a particular Covered Entity for a particular tax year, certain terms used in paragraphs 6(f)(i) and 6(f)(ii) are defined as follows:
A. An audit opinion is an opinion of an independent certified public or chartered accountant who audited the Financial Statements.
B. An accountant’s report is a report of an independent certified public or chartered accountant who is associated with the Financial Statements.
C. A self-certification is an attestation, as defined in paragraph 6(f)(iii)(E), that the Financial Statements have been prepared according to the Applicable Accounting Standard.
D. A tying certification consists of the following:
(1) An attestation, as defined in paragraph 6(f)(iii)(E), that the Financial Statements can be reconciled to the consolidated Financial Statements for that entity’s direct or indirect parent according to workpapers provided with the attestation;
(2) The workpapers referred to in paragraph 6(f)(iii)(D)(1), which must demonstrate the consolidation of the Covered Entity’s Financial Statements into the Financial Statements of the parent referred to in paragraph 6(f)(iii)(D)(1);
(3) The Financial Statements of the parent referred to in paragraph 6(f)(iii)(D)(1); and
(4) An audit opinion (as defined in paragraph 6(f)(iii)(A)) for the Financial Statements of the parent referred to in paragraph 6(f)(iii)(D)(1).
E. An attestation is an affirmation by an officer of the Covered Entity in the following form:
I, [Officer’s Name and Title], of [Name of Covered Entity] affirm under penalties of perjury that the facts stated below are true. I either have adequate first-hand knowledge to make this affirmation or have gained adequate knowledge to make this affirmation through diligent consultation(s) with one or more individuals who have first-hand knowledge.
[Facts attested to.]
[Signature]
g. In accordance with section 7.04 of Rev. Proc. 2015-41, U.S. Taxpayer will (1) maintain the APA Records, and (2) make them available to the IRS in connection with an examination under section 7.03 of Rev. Proc. 2015-41. Compliance with this subparagraph constitutes compliance with the record-maintenance provisions of Code sections 6038A and 6038C for the Covered Issue(s) for any APA Covered Year.
h. The “true taxable income” within the meaning of U.S. Treasury Regulations sections 1.482-1(a)(1) and (i)(9) of a member of an affiliated group filing a U.S. consolidated return will be determined under the U.S. Treasury Regulations under Code section 1502.
i. To the extent that U.S. Taxpayer’s compliance with this APA depends on certain acts of other members of Worldwide Group, U.S. Taxpayer will ensure that such other members will perform such acts.
7. Critical Assumptions. The Critical Assumptions, which are this APA’s critical assumptions as defined in Rev. Proc. 2015-41, appear in Appendix B. If any Critical Assumption has not been met, then Rev. Proc. 2015-41, section 7.06, governs, as modified by Appendix B to this APA.
8. Disclosure. This APA, and any background information related to this APA or the APA Request, are: (1) considered “return information” under Code section 6103(b)(2)(C); and (2) not subject to public inspection as a “written determination” under Code section 6110(b)(1). Section 521(b) of Pub. L. 106-170 provides that the Secretary of the Treasury must prepare a report for public disclosure that includes certain specifically designated information concerning all APAs, including this APA, in a form that does not reveal taxpayers’ identities, trade secrets, and proprietary or confidential business or financial information.
9. Disputes. If a dispute arises concerning the interpretation or application of this APA, the Parties will seek a resolution by the Director, Treaty and Transfer Pricing Operations, to the extent reasonably practicable, before seeking alternative remedies.
10. Materiality. In this APA the terms “material” and “materially” will be interpreted in a manner consistent with the description of “material facts” in Rev. Proc. 2015-41, section 7.06(4).
11. Paragraph Captions. This APA’s paragraph captions, which appear in italic type, are for convenience and reference only. The captions do not affect in any way the interpretation or application of this APA.
12. Terms and Definitions.
a. Unless otherwise specified, terms in the plural include the singular and vice versa.
b. Appendix A contains definitions for certain terms used in this APA’s body and appendices.
c. Certain terms used in this APA’s body and appendices are defined as follows:
| Term | Definition |
|---|---|
| Annual Report | A report within the meaning of Rev. Proc. 2015-41, section 7.02. |
| Advance Pricing Agreement, or “APA” | An “advance pricing agreement” within the meaning of Rev. Proc. 2015-41, section 2.02. Unless context indicates otherwise, “this APA” or “the APA” denotes the particular APA that is executed below. |
| APA Records | (Defined in Appendix C.) |
| APA Request | U.S. Taxpayer’s request for this APA, which was dated #DATE, including any amendments or supplemental or additional information thereto (including but not limited to any responses to due diligence questions). |
| Critical Assumptions | (Defined in paragraph 7.) |
| Financial Statements | Balance sheet, income statement, statement of cash flow, and explanatory notes, prepared in accordance with the Applicable Accounting Standard as defined in section 7 of Appendix A. |
| Non-U.S. Group | In any APA Tax Year, Worldwide Group members that are not U.S. persons. |
| Parties | (Defined in the Recitals near the start of this APA.) |
| Pub. L. 106-170 | The Ticket to Work and Work Incentives Improvement Act of 1999. |
| U.S. Effective Date | (Defined in paragraph 17 and in section 7 of Appendix A. Those definitions are intended to have the same meaning. In case of conflict, the definition in paragraph 17 controls.) |
| U.S. Group | In any APA Tax Year, Worldwide Group members that are U.S. persons. |
| Worldwide Group | In any APA Tax Year, U.S. Taxpayer and all organizations, trades, businesses, entities, or branches (whether or not incorporated, organized in the United States, or affiliated) owned or controlled directly or indirectly by the same interests. |
13. Deadline References. If a deadline under this APA falls on a Saturday, Sunday, or a legal holiday in the District of Columbia, the deadline is extended to the next succeeding day that is not a Saturday, Sunday, or legal holiday in the District of Columbia.
14. Entire Agreement and Severability. This APA is the complete statement of the Parties’ agreement. The Parties will sever, delete, or reform any invalid or unenforceable provision in this APA to approximate the Parties’ intent as nearly as possible.
15. Successor in Interest. This APA binds, and inures to the benefit of, any successor in interest to U.S. Taxpayer.
16. Notice. Any notices required by this APA or Rev. Proc. 2015-41 must be in writing. U.S. Taxpayer will send notices to the IRS at:
Commissioner, Large Business and International Division
Internal Revenue Service
1111 Constitution Avenue, NW
SE:LB:TTPO:APMA:NCA534-01
Washington, DC 20224
(Attention: APMA)
The IRS will send notices to:
#NAME AND ADDRESS
(phone: #PHONE)
The IRS also will send notices to, if applicable:
[] #REPRESENTATIVE’S NAME AND ADDRESS
(phone: #PHONE)
provided that a valid IRS Form 2848 “Power of Attorney and Declaration of Representative” for that person was included in the most recent Annual Report (or, if no Annual Report has been filed, was included in the APA Request).
17. U.S. Effective Date and Counterparts. This APA is effective starting on the date, or later date of the dates, upon which all Parties execute this APA (“U.S. Effective Date”). The Parties may execute this APA in counterparts, with each counterpart constituting an original.
WITNESS,
The Parties have executed this APA on the dates below.
#SIGNATORY NAME IN BOLD FACE BLOCK CAPITAL LETTERS
By: __________________________Date: _________________, 20____
#NAME
#TITLE
INTERNAL REVENUE SERVICE
By: __________________________Date: _________________, 20____
John C. C. Hughes
Director, Advance Pricing and Mutual Agreement Program
1 In 2017, Transfer Pricing Operations became Treaty & Transfer Pricing Operations.
2 The first APA Statutory Report, which compiled APA data from 1991-1999, did not report the cumulative number of applications for those years by submission type, so the cumulative totals cannot be reported in that manner.
3 Executed APAs refer to all APAs finalized or renewed.
4 The number of renewals executed is included in the total number of APAs executed during the year.
5 The number of renewals still pending as of year-end is also included in the total number of pending APAs.
6 The first APA Statutory Report, which compiled APA data from 1991-1999, did not report the cumulative number of applications for those years by submission type, so the cumulative totals cannot be reported in that manner.
7 See supra note 6.
8 APAs often cover more than one type of transaction.
9 Not all the executed APAs involve a tested party.
10 See Treas. Reg. § 1.482-5(b)(4)(ii)(A).
11 See Treas. Reg. § 1.482-5(b)(4)(ii)(B).
12 The majority of APAs that covered services transactions also included tangible/intangible transactions and are not tested under a separate PLI.
13 The source of this list is the 2009 Model APA and requirements remain largely unchanged in the 2015 Model APA.
14 As a result, almost all occurrences of the hashtag in the template will be replaced with a caret or other text in the taxpayer's draft APA. The few remaining occurrences of the hashtag will mark a placeholder phrase that cannot yet be replaced with appropriate text (see, for example, the placeholder phrase in paragraph 6(e) for a date that cannot be determined until the APA nears nt.
15 As used in this APA, "income allocation" includes allocation of loss.
Section 1 of this Appendix lists the Covered Entities. Section 2 defines the APA Term, APA Tax Years, and APA Covered Years. Section 3 describes the Covered Issue(s). Section 4 describes the Covered Method applicable to each Covered Issue.
Section 5 describes the application of the Covered Method(s) to income reporting and the possible need for an APA Primary Adjustment under one or more Covered Methods. Section 6 addresses conforming adjustments and repatriation of funds following APA Primary Adjustments.
Section 7 provides definitions that apply both to this Appendix and to the APA as a whole. The definitions table is based on a standard, inclusive model, and thus may include terms not used in this APA.
The U.S. Covered Entity(ies) are:
#LIST OF EACH U.S. ENTITY INVOLVED IN ONE OR MORE COVERED ISSUE(S), AND ALSO (LISTED FIRST) ANY CONSOLIDATED RETURN PARENT FOR ANY SUCH ENTITY. FOR EACH ENTITY, NAME, ADDRESS, PHONE, AND EIN.
The term “U.S. Taxpayer” includes collectively all U.S. Covered Entities and any other entities that are in a consolidated return group with a U.S. Covered Entity.
The Non-U.S. Covered Entity(ies) are:
# LIST OF EACH NON-U.S. ENTITY INVOLVED IN ONE OR MORE COVERED ISSUE(S), AND ALSO (LISTED FIRST) ANY COMMON TAX REPORTING PARENT FOR ANY SUCH ENTITY. FOR EACH ENTITY, NAME, ADDRESS, AND PHONE.
The term “Non-U.S. Taxpayer” includes collectively all Non-U.S. Covered Entities and any other entities that are in a common tax reporting group with a Non-U.S. Covered Entity.
The term “Covered Entities” includes both the U.S. Covered Entities and the Non-U.S. Covered Entities.
The APA applies to the period from #DATE to #DATE, inclusive (the “APA Term”).
[] The APA Term does not include a Rollback.
[] The APA Term includes a Rollback, which covers from #DATE to #DATE, inclusive (the “Rollback Period”).
A tax year of U.S. Taxpayer that is wholly or partly contained in the APA Term is called an “APA Tax Year.” For a particular APA Tax Year, the portion of such APA Tax Year that is contained in the APA Term is called an “APA Covered Year.” Such APA Tax Year and APA Covered Year are said to “correspond” to each other or to be “corresponding.”
The Covered Issue(s) are as described below.
Covered Issue 1:
#DESCRIPTION OF COVERED ISSUE.
Each Covered Method applies to one or more Covered Issues. A Covered Method and the Covered Issue(s) to which the Covered Method applies are said to “correspond,” or to be “corresponding”.
The Covered Methods are summarized in the following table and are described in detail below. In case of conflict with this table, the detailed descriptions of the Covered Methods below, and the descriptions in section 3 above of the Covered Issues, control.
| Covered Method Number | Applies to Covered Issues Number(s) | Summary Description of Corresponding Covered Issues | Type of Method; Results Tested | Point or Range | Testing Frequency and Periods |
|---|---|---|---|---|---|
| 1 |
This Appendix A uses the term “Tested Party.” When applied in the context of methods that consider, or test, data from only one party to a transaction, this term is similar in concept to the term “tested party” as discussed in the OECD Guidelines paragraphs 3.18 and 3.19, and as defined in the U.S. Treasury Regulations section 1.482-5(b)(2). However, some methods consider, or test, data from both parties to a transaction, where there is no singular “tested” party. Even in applying such methods, however, it is typically the case that one particular party’s results are formally tested for compliance with the method. For purposes of this template, in such circumstances, the party whose results are formally tested in applying any particular method is the “Tested Party”, even if that party is not strictly a “tested party” as discussed in the OECD Guidelines paragraphs 3.18 and 3.19, or as defined in the U.S. Treasury Regulations section 1.482-5(b)(2).
Covered Method for Covered Issue 1:
[] The Covered Method is an implementation of the comparable uncontrolled price method under the OECD Guidelines and of the comparable uncontrolled price method under the U.S. Treasury Regulations. The Tested Party’s financial results to be tested are:
[] per unit price paid, defined as the total amount paid for #DESCRIPTION OF GOODS divided by the number of #DESCRIPTION OF A UNIT OF GOODS purchased.
[] per unit price received, defined as the total amount received for #DESCRIPTION OF GOODS divided by the number of #DESCRIPTION OF A UNIT OF GOODS sold.
[] The Covered Method is an implementation of the comparable uncontrolled price method under the OECD Guidelines and of the comparable uncontrolled services price method under the U.S. Treasury Regulations. The Tested Party’s financial results to be tested are:
[] per unit price paid, defined as the total amount paid for #DESCRIPTION OF SERVICES divided by the number of #DESCRIPTION OF A UNIT OF SERVICES received.
[] per unit price received, defined as the total amount received for #DESCRIPTION OF SERVICES divided by the number of #DESCRIPTION OF A UNIT OF SERVICES provided.
[] The Covered Method is an implementation of the comparable uncontrolled price method under the OECD Guidelines and of the comparable uncontrolled transaction method under the U.S. Treasury Regulations. The Tested Party’s financial results to be tested are the royalty paid for the license of #DESCRIPTION OF LICENSED INTANGIBLE PROPERTY divided by the Tested Party’s:
[] sales revenue from sales of #DESCRIPTION OF GOODS/SERVICES.
[] #OTHER ROYALTY BASE.
[] The Covered Method is an implementation of the comparable uncontrolled price method under the OECD Guidelines and of the acquisition price method under the U.S. Treasury Regulations. The Tested Party’s financial results to be tested are described in subsection (c) below.
[] The Covered Method is an implementation of the comparable uncontrolled price method under the OECD Guidelines and of the market capitalization method under the U.S. Treasury Regulations. The Tested Party’s financial results to be tested are described in subsection (c) below.
[] The Covered Method is an implementation of the resale price method under the OECD Guidelines and of the resale price method under the U.S. Treasury Regulations. The Tested Party’s financial results to be tested are the gross profit margin from the sale of #DESCRIPTION OF GOODS.
[] The Covered Method is an implementation of the resale price method under the OECD Guidelines and of the gross services margin method under the U.S. Treasury Regulations. The Tested Party’s financial results to be tested are the gross services margin from the provision of #DESCRIPTION OF SERVICES.
[] The Covered Method is an implementation of the cost plus method under the OECD Guidelines and of the cost plus method under the U.S. Treasury Regulations. The Tested Party’s financial results to be tested are the gross profit markup.
[] The Covered Method is an implementation of the cost plus method under the OECD Guidelines and of the cost of services plus method under the U.S. Treasury Regulations. The Tested Party’s financial results to be tested are the gross services profit markup from the provision of #DESCRIPTION OF SERVICES.
[] The Covered Method is based on the principles of the low value-adding intra-group services approach under the OECD Guidelines and of the services cost method under the U.S. Treasury Regulations. The Tested Party’s financial results to be tested are the markup on total costs for providing #DESCRIPTION OF SERVICES.
[] The Covered Method is an implementation of the transactional net margin method under the OECD Guidelines and of the comparable profits method under the U.S. Treasury Regulations. The Tested Party’s financial results to be tested, as reflected in its net profit indicator (per OECD Guidelines) or profit level indicator (per U.S. Treasury Regulations), are its:
[] operating margin.
[] markup on total costs.
[] Berry ratio.
[] return on operating assets.
[] return on invested capital.
[]* #OTHER NET PROFIT INDICATOR OR PROFIT LEVEL INDICATOR, WITH DEFINITION.
[] The Covered Method is an implementation of the profit split (residual analysis) method under the OECD Guidelines and of the residual profit split method under the U.S. Treasury Regulations. The Tested Party’s financial results to be tested are described in subsection (c) below.
[] The Covered Method is an implementation of the profit split (contribution analysis) method under the OECD Guidelines and of the comparable profit split method under the U.S. Treasury Regulations. The Tested Party’s financial results to be tested are described in subsection (c) below.
[] The Covered Method is an implementation of an income based valuation technique as referenced in paragraph 6.153 of the OECD Guidelines and of the income method under the U.S. Treasury Regulations. The Tested Party’s financial results to be tested are described in subsection (c) below.
[] The Covered Method is an implementation of (i) a sharing of the cost of current contributions in proportion to overall expected benefits, within a cost contribution arrangement under the OECD Guidelines, and (ii) a sharing of intangible development costs in proportion to reasonably anticipated benefits, within a cost sharing arrangement under the U.S. Treasury Regulations. The Tested Party’s financial results to be tested are described in subsection (c) below.
[] The Covered Method is a method that is not specified under the OECD Guidelines and not specified under the U.S. Treasury Regulations. The Tested Party’s financial results to be tested are described in subsection (c) below.
Such financial results are determined according to the Applicable Accounting Standard, with the proviso that in determining such results, accounting principles and conventions that are generally accepted in the trade or industry must be used.
Such financial results are tested against a point or range as described below. The test is carried out with a frequency, and for certain time periods, as described below. If and when these financial results do not satisfy the test, they must be adjusted as described in section 5 of this Appendix A.
The Tested Party’s financial results are tested as follows:
[] The financial results must equal #X.
[] The financial results must be within an Arm’s Length Range.
[] The Arm’s Length Range is from #X to #Y inclusive.
[] This Arm’s Length Range has an associated Median value of #Z.
[] This Arm’s Length Range has no associated Median value.
[] Two Arm’s Length Ranges apply. The first is from #W to #X inclusive and applies to the annual test described in subsection (d) below. The second is from #Y to #Z inclusive and applies to the term test described in subsection (d) below.
[] The first Arm’s Length Range has an associated Median value of #P, and the second Arm’s Length Range has an associated Median value of #Q.
[] These Arm’s Length Ranges have no associated Median value.
[] Two Arm’s Length Ranges apply. The first is from #W to #X inclusive and applies to the subterm test described in subsection (d) below. The second is from #Y to #Z inclusive and applies to the annual test described in subsection (d) below.
[] The first Arm’s Length Range has an associated Median value of #P, and the second Arm’s Length Range has an associated Median value of #Q.
[] These Arm’s Length Ranges have no associated Median value.
[] Two Arm’s Length Ranges apply. The first is from #W to #X inclusive and applies to the test for the first subterm described in subsection (d) below. The second is from #Y to #Z inclusive and applies to the test for the second subterm described in subsection (d) below.
[] The first Arm’s Length Range has an associated Median value of #P, and the second Arm’s Length Range has an associated Median value of #Q.
[] These Arm’s Length Ranges have no associated Median value.
[] #OTHER DESCRIPTION, FOR EXAMPLE THE EVALUATION AND TESTING MECHANICS FOR A PROFIT SPLIT, AN INCOME METHOD, AN UNSPECIFIED METHOD, OR A SHARING OF COSTS UNDER A COST CONTRIBUTION ARRANGMENT/COST SHARING ARRANGEMENT.
The Tested Party’s financial results are tested as of certain APA Covered Years, and for certain time periods, as follows:
[] The results are tested annually, meaning that they are tested as of each APA Covered Year, for a period consisting of that APA Covered Year.
[] There is no additional term test.
[] There is an additional term test. For this test, the results are tested as of the Last Effective APA Covered Year, for the period consisting of the Last Effective APA Covered Year and all prior APA Covered Years.
The application of the annual test and the application of the additional term test are coordinated as described in section 5 of this Appendix A.
[]* The results are tested on a term basis, meaning that they are tested only once, as of the Last Effective APA Covered Year, for a period consisting of the Last Effective APA Covered Year and all prior APA Covered Years.
[]* The results are tested on the basis of two subterms. For this purpose, the APA Term is divided into two subterms. The first subterm consists of all APA Covered Years ending on or before #DATE, and the second subterm consists of all other APA Covered Years. For each subterm, the results are tested as of the Last Effective APA Subterm Covered Year, for a period consisting of the Last Effective APA Subterm Covered Year and all prior APA Covered Years in the subterm.
[]* The results are tested on a subterm basis for all APA Covered Years ending on or before #DATE (the “subterm”), and are tested annually for each other APA Covered Year, as follows:
The results are tested as of the Last Effective APA Subterm Covered Year, for a period consisting of the Last Effective APA Subterm Covered Year and all prior APA Covered Years in the subterm.
The results are tested as of each APA Covered Year that is not in the subterm, for a period consisting of that APA Covered Year.
[]* The results are tested on a cumulative basis, meaning that (except as provided in the following sentence) they are not tested as of the first APA Covered Year but they are tested as of each other particular APA Covered Year for a period consisting of such particular APA Covered Year and all prior APA Covered Years. However, if the Last Effective APA Covered Year is the first APA Covered Year, then the results are tested as of the first APA Covered Year, for a period consisting of such APA Covered Year.
[]* The results are tested on a three-year rolling average basis, meaning that the results are tested as of each APA Covered Year, for a period consisting of the APA Tax Year corresponding to the APA Covered Year (but excluding any portion of that APA Tax Year that is after the APA Term), and the Tested Party’s two preceding tax years.
The Tested Party’s financial results, to be tested as described above, are for:
[] The Tested Party as a whole.
[] Only a segment of the Tested Party’s activity. #DETAILED DESCRIPTION OF THE SEGMENT AND OF THE ALLOCATION AND APPORTIONMENT METHODS USED, INCLUDING ANY APPLICABLE FORMULAS AND DEFINITIONS OF QUANTITIES USED IN THOSE FORMULAS. THIS DESCRIPTION SHOULD BE DETAILED ENOUGH TO ENABLE A STRAIGHTFORWARD VERIFICATION OF COMPLIANCE BY THE IRS EXAMINATION TEAM.
When the Tested Party’s financial results are tested as of a given APA Covered Year, those results shall reflect, to the extent relevant, any APA Primary Adjustment for this Covered Method made under section 5 of this Appendix A for the APA Tax Year corresponding to any prior APA Covered Year.
For this Covered Method, if applicable:
[]* For APA Covered Years ending on or before #DATE, it is agreed that this Covered Method, yields financial results as shown below, and that any APA Primary Adjustments under section 5 of this Appendix A are as shown below.
#TEXT AND/OR TABLES SHOWING THE FINANCIAL RESULTS, THE TESTING OF THOSE FINANCIAL RESULTS UNDER THE COVERED METHOD, AND ANY RESULTING APA PRIMARY ADJUSTMENTS.
For this Covered Method, if applicable:
[] This Covered Method addresses the pricing for a transfer of intangible property (which does not constitute a platform contribution transaction as defined in U.S. Treasury Regulations section 1.482-7(b)(1)(ii)) within the meaning of U.S. Treasury Regulations section 1.482-4. That pricing will not be subject to periodic adjustments by the IRS, during or after the APA Term, under U.S. Treasury Regulations section 1.482-4(f)(2) or (6).
[] This Covered Method addresses the pricing for a platform contribution transaction (“PCT”). That PCT will not be treated as a Trigger PCT within the meaning of U.S. Treasury Regulations section 1.482-7(i)(6)(i) for purposes of making periodic adjustments, during or after the APA Term, under U.S. Treasury Regulations section 1.482-7(i)(6).
For each APA Tax Year, and for each Covered Method and corresponding Covered Issue(s), the amounts reported by U.S. Taxpayer and Non-U.S. Taxpayer for income tax purposes under the laws of the United States and #COUNTRY(IES) must clearly reflect the Tested Party’s actual transactions, allocations, and/or recordkeeping, as applicable, that relate to such Covered Issue(s), adjusted as necessary to conform with section 4 of this Appendix A. Accordingly, for each particular APA Tax Year and corresponding APA Covered Year, and for each such Covered Method:
i. If the Tested Party’s financial results are tested as of such APA Covered Year and do not conform with section 4 of this Appendix A, then the tax reporting for such APA Tax Year must clearly reflect an adjustment that brings such results into conformance (an “APA Primary Adjustment”). If section 4 of this Appendix A specifies conformance to an Arm’s Length Range, then the adjustment shall be to:
[] the Median.
[]* the near edge of the Arm’s Length Range.
[]* the Median for Covered Issues #SPECIFY WHICH ONES, and the near edge of the Arm’s Length Range for Covered Issues #SPECIFY WHICH ONES.
ii. If an adjustment is not required under paragraph (i) above, then the tax reporting must clearly reflect the Tested Party’s financial results, with no adjustment. In this case there is no APA Primary Adjustment.
iii. If both an annual test and an additional term test apply under such Covered Method, and such APA Covered Year is the Last Effective APA Covered Year, so that as of such APA Covered Year the Tested Party’s financial results are tested under both the annual test and the term test, then paragraphs (i) and (ii) above are modified by this paragraph (iii), which coordinates the application of both tests. As explained in more detail below, the annual test is applied first, followed by the term test. Specifically, the need for and amount of any APA Primary Adjustment for such APA Covered Year will be determined as follows:
A. First apply paragraphs (i) and (ii) above under the assumption that only the annual test applies. Any required adjustment will be referred to as the “annual adjustment” rather than an “APA Primary Adjustment.” If there is no required adjustment, the annual adjustment is considered to be zero.
B. Next, apply paragraphs (i) and (ii) above to the Tested Party’s financial results as adjusted by any nonzero annual adjustment, under the assumption that only the term test applies to those results. Any required adjustment under this application of paragraphs (i) and (ii) will be referred to as the “term adjustment” rather than an “APA Primary Adjustment.” If there is no such required adjustment, the term adjustment is considered to be zero.
C. Add the annual adjustment and term adjustment, taking account of the magnitude and (if nonzero) direction of each. If this sum is zero, there is no APA Primary Adjustment for such APA Covered Year. If this sum is nonzero, this sum gives the magnitude and direction of the APA Primary Adjustment for such APA Covered Year. Any APA Primary Adjustment, or the lack of an APA Primary Adjustment, must be clearly reflected in the tax reporting for such APA Tax Year (see paragraphs (i) and (ii) above).
iv. If this APA is unilateral and such APA Covered Year is within the Rollback Period, then:
[] Paragraphs (i)-(iii) above notwithstanding, an APA Primary Adjustment will not be made if that APA Primary Adjustment would decrease the income of U.S. Taxpayer for such APA Tax Year.
[]* Paragraphs (i)-(iii) above apply without modification.
If indicated, the above provisions on APA Primary Adjustments are modified as follows:
[]* Any APA Primary Adjustment that would be made under the above provisions for an APA Tax Year ending before #DATE will instead be made for the APA Tax Year ending #THE SAME DATE (the “Telescoping Year”). For each particular Covered Method, all APA Primary Adjustments that are made for the Telescoping Year (including any APA Primary Adjustments that are moved to the Telescoping Year as just described, as well as any APA Primary Adjustment originally made for the Telescoping Year) are netted.
[] The foregoing provision applies without modification.
[] The foregoing provision applies with the following modification. An APA Primary Adjustment that is thus moved from a particular APA Tax Year (the “Original Year”) to the Telescoping Year shall be increased in amount to reflect the time value of money. That increase will consist of multiplication by a factor that is an annual rate raised to a power. The annual rate is 1.#XY. The power is the quotient of (i) the average of the number of months by which the end of the Telescoping Year is later than the end of the Original Year, and the number of months by which the start of the Telescoping Year is later than the start of the Original Year (with any fractions of months rounded to whole months), (ii) divided by twelve.
For U.S. tax purposes, the generally applicable Code rules will apply with respect to APA Primary Adjustments, except as otherwise provided in Rev. Proc. 2015-41 or in this APA.
The provisions in this section 6 apply to “Repatriable Issues,” which are Covered Issues that concern transactions between associated enterprises that fall under Article 9 of the OECD Model Tax Convention. Such transactions correspond to transactions that under U.S. law are subject to application of Code section 482, as modified by any applicable treaty provision.
If the application of a Covered Method to a Repatriable Issue requires an APA Primary Adjustment under section 5 of this Appendix A for a given APA Tax Year, then for U.S. tax purposes there generally must be a corresponding conforming adjustment as specified in U.S. Treasury Regulations section 1.482-1(g)(3) as amplified by Rev. Proc. 99-32 or any successor revenue procedure. However, for this purpose, all APA Primary Adjustments for such APA Tax Year arising from the application of a Covered Method to a Repatriable Issue are first netted to yield a net APA Primary Adjustment for such APA Tax Year. Only if the net APA Primary Adjustment is nonzero is a conforming adjustment required.
For each APA Tax Year with a nonzero net APA Primary Adjustment, for U.S. tax purposes the conforming adjustment will be accomplished in the following steps:
i. The conforming adjustment will be accomplished between #U.S. ENTITY and #NON-U.S. ENTITY, which will be referred to here as “U.S. Entity” and “Non-U.S. Entity”, respectively. An intercompany payable will be established between U.S. Entity and Non-U.S. Entity in the amount and direction of the net APA Primary Adjustment, as of the last day of such APA Tax Year. This payable will be denominated in #CURRENCY. The payable will be treated as indebtedness for all U.S. federal tax purposes; provided, however, that the payable will not be treated as indebtedness for purposes of Code section 956 if the payable is satisfied within 90 days of the close of the APA Tax Year with respect to which it is established.
ii. [] The intercompany payable will bear interest at an arm’s length rate.
[] Such arm’s length rate is not specified in this APA and will be determined under applicable legal principles.
[] Such arm’s length rate is determined as follows. #DESCRIPTION OF ARM’S LENGTH RATE (FOR EXAMPLE, FOR A U.S. DOLLAR PAYABLE, A CERTAIN APPLICABLE FEDERAL RATE UNDER U.S. TREASURY REGULATIONS SECTION 1.482-2(a)(2)(iii)(C)).
[] This APA is bilateral or multilateral. As agreed between the United States and #COUNTRY(IES), the intercompany payable will not bear interest.
iii. The intercompany payable must be satisfied, in a manner permitted under Rev. Proc. 99-32 or any successor revenue procedure, within 90 days of the later of (1) the date for timely filing (with extensions) of the U.S. return for such APA Tax Year, and (2) the APA’s U.S. Effective Date. If any amount of the intercompany payable is not otherwise so satisfied within that 90-day period, such amount, on the last day of such period, will be deemed (1) to be paid between U.S. Entity and Non-U.S. Entity in satisfaction of the payable, and (2) to be paid (directly or indirectly, as specified below) between U.S. Entity and Non-U.S. Entity in the opposite direction (that is, from the deemed recipient of the intercompany payable to the deemed payor of the intercompany payable). These two deemed payments on the same day will cancel and thus yield no net cash flow between these two entities. The second of these deemed payments will be referred to as the “reverse payment.” The reverse payment will be deemed to be as follows:
A. If the net APA Primary Adjustment increases U.S. income:
[] The reverse payment will be deemed to be a contribution to capital from U.S. Entity to Non-U.S. Entity, either directly, or indirectly through the corporate chain, as the case may be.
[] The reverse payment will be deemed to be a distribution from U.S. Entity to Non-U.S. Entity, either directly, or indirectly through the corporate chain, as the case may be.
[] The reverse payment will be deemed to be a distribution from U.S. Entity to #COMMON PARENT, either directly, or indirectly through the corporate chain, as the case may be, followed by a contribution by #COMMON PARENT to non-U.S. Entity, either directly or indirectly through the corporate chain, as the case may be.
B. If the net APA Primary Adjustment decreases U.S. income:
[] The reverse payment will be deemed to be a contribution to capital from non-U.S. Entity to U.S. Entity, either directly, or indirectly through the corporate chain, as the case may be.
[] The reverse payment will be deemed to be a distribution from non-U.S. Entity to U.S. Entity, either directly, or indirectly through the corporate chain, as the case may be.
[] The reverse payment will be deemed to be a distribution from non-U.S. Entity to #COMMON PARENT, either directly, or indirectly through the corporate chain, as the case may be, followed by a contribution by #COMMON PARENT to U.S. Entity, either directly, or indirectly through the corporate chain, as the case may be.
This situation is generally described in paragraph 4.66 of the OECD Guidelines, and in U.S. Treasury Regulations section 1.482-1(g) and Rev. Proc. 99-32.
In this APA, if applicable:
[]* For the APA Tax Year(s) ending on or before #DATE, it is agreed that the net APA Primary Adjustment(s), if any, from the application of the Covered Methods are as follows: #FOR EACH SUCH APA TAX YEAR, DESCRIPTION OF WHETHER THERE IS A NET APA PRIMARY ADJUSTMENT, AND IF SO THE AMOUNT AND DIRECTION. IF THERE IS MORE THAN ONE COVERED METHOD FOR A REPATRIABLE ISSUE, ALSO PROVIDE A TABLE SHOWING THE DERIVATION, FOR EACH SUCH APA TAX YEAR, OF THE NET APA PRIMARY ADJUSTMENT FROM THE APA PRIMARY ADJUSTMENT (OR LACK OF ONE) FOR EACH SUCH COVERED METHOD. #FOR ANY SUCH NET APA PRIMARY ADJUSTMENTS, DESCRIPTION OF THE MEANS BY WHICH THE CONFORMING ADJUSTMENT HAS BEEN OR WILL BE SATISFIED, WITH APPLICABLE DATES.
The definitions in the table below apply to this APA.
The defined terms in this table include certain measures of profitability (e.g., operating profit, operating margin). Most of these measures are ultimately defined in terms of sales revenue, operating expenses, and operating assets (defined terms), and cogs and non-interest-bearing liabilities (undefined terms). The definitions of sales revenue, operating expenses, and operating assets contain a limitation to the relevant business activity. Similarly, each use of the terms “cogs” and “non-interest-bearing liabilities” is accompanied by a limitation to the relevant business activity. Therefore, the measures of profitability based on these five terms all are defined with a limitation to the relevant business activity. (Certain other measures of profitability in this table relate to the provision of services and are defined with reference to those services. Therefore, those measures as well contain a limitation to the relevant business activity.)
| Term | Definition |
|---|---|
| Arm’s Length Range | With respect to a particular Covered Method, a numerical range that defines the values for which certain financial results of the Tested Party are considered to satisfy the arm’s length standard. (This term may be referenced in section 4 of this Appendix A.) |
| APA Primary Adjustment | (Defined in section 5 of this Appendix A.) |
| APA Covered Year | (Defined in section 2 of this Appendix A.) |
| APA Term | (Defined in section 2 of this Appendix A.) |
| APA Tax Year | (Defined in section 2 of this Appendix A.) |
| Applicable Accounting Standard | The Applicable Accounting Standard is #CHOOSE FROM U.S. GAAP, IFRS, ETC. for U.S. Taxpayer and #CHOOSE FROM U.S. GAAP, IFRS, ETC. for Non-U.S. Taxpayer. |
| Berry ratio | The ratio of gross profit to operating expenses. |
| Code | The U.S. Internal Revenue Code of 1986, title 26 of the United States Code, as amended. |
| correspond, corresponding | (With regard to APA Covered Years and APA Tax Years, defined in section 2 of this Appendix A; with regard to Covered Issues and Covered Methods, defined in section 4 of this Appendix A.) |
| Covered Entity(ies) | (Defined in section 1 of this Appendix A.) |
| Covered Issue(s) | (Defined in section 3 of this Appendix A.) |
| Covered Method | A method used to resolve one or more Covered Issues, as described in section 4 of this Appendix A. (In some cases, this method may be a “transfer pricing method” within the meaning of chapter II of the OECD Guidelines and U.S. Treasury Regulations section 1.482-1(b).) |
| Critical Assumption fails, failure of a Critical Assumption | A Critical assumption “fails” when the Critical Assumption has not been met. This situation is referred to as the “failure” of the Critical Assumption. |
| Early Termination | A termination of this APA’s effectiveness, either in its entirely or only as applied to certain Covered Issues, before the end of the APA Term. Such a termination could result from one or more of the following circumstances: (i) a Critical Assumption failure, (ii) a violation of the terms and conditions of this APA, (iii) a cancellation of the APA under Rev. Proc. 2015-41, and (iv) an amendment of the APA. If an Early Termination so terminates this APA’s effectiveness as applied to a particular Covered Issue, the Early Termination is said to “apply” to or for that Covered Issue. Any such termination of effectiveness would occur as of the end of an APA Tax Year (see Rev. Proc. 2015-41, section 7.06). Because such end of an APA Tax Year is before the end of the APA Term, such end of an APA Tax Year is also the end of the corresponding APA Covered Year (see the definitions of APA Tax Year and APA Covered Year in section 2 of this Appendix A). Thus, an Early Termination always would occur as of the end of an APA Covered Year. That fact is assumed in the definitions in this table of Last Effective APA Covered Year and Last Effective APA Subterm Covered Year. |
| Gross profit | Sales revenue, less cost of goods sold for the relevant business activity. |
| Gross profit margin | gross profit, divided by sales revenue |
| Gross profit markup | gross profit, divided by cost of goods sold for the relevant business activity |
| Gross services margin | In connection with a provision of services, the ratio of gross services profit to the price paid for the services in an uncontrolled transaction. For this purpose, gross services profit equals the amount of such price that is retained by the Tested Party. |
| Gross services profit markup | In connection with a provision of services, gross services profit, divided by transactional costs. For this purpose, gross services profit equals sales revenue less transactional costs. Also, for this purpose, transactional costs equal costs directly attributable to providing the services. Such costs would include, for example, all compensation attributable to employees directly involved in the performance of such services, and costs of materials and supplies consumed or made available in rendering the services. |
| IFRS | International Financial Reporting Standards. |
| Invested capital | Operating assets, less non-interest-bearing liabilities used in the relevant business activity. |
| IRS | The Internal Revenue Service, an agency of the U.S. government. |
| IFRS | International Financial Reporting Standards. |
| Last Effective APA Covered Year | For a particular Covered Method, the last APA Covered Year for which this APA remains effective as to the Covered Issue(s) corresponding to that Covered Method. The Last Effective APA Covered Year will be the last APA Covered Year unless an Early Termination applies to such Covered Issue(s). See also the definition in this table of Early Termination. |
| Last Effective APA Subterm Covered Year | For a particular Covered Method, and with reference to a particular set of APA Covered Years that is defined as a subterm, the last APA Covered Year in the subterm for which this APA remains effective as to the Covered Issue(s) corresponding to that Covered Method. The Last Effective APA Subterm Covered Year will be the last APA Covered Year in the subterm unless an Early Termination applies to such Covered Issue(s) and renders the APA ineffective as to such Covered Issue(s) before the end of the subterm. See also the definition in this table of Early Termination. |
| Markup on total costs | The ratio of operating profit to total costs. |
| Median | With respect to a particular Arm’s Length Range, the median of a set of observations of market data from which that Arm’s Length Range was determined. |
| Non-U.S. Taxpayer | (Defined in section 1 of this Appendix A.) |
| Non-U.S. Covered Entity(ies) | (Defined in section 1 of this Appendix A.) |
| OECD Guidelines | Organisation for Economic Co-operation and Development, OECD Transfer Pricing Guidelines for Multinational Enterprises and Tax Administrations (July 2017). |
| OECD PE Report | Organisation for Economic Co-operation and Development, 2010 Report on Attribution of Profit to Permanent Establishments (July 22, 2010). |
| Operating assets | The value of all assets used in the relevant business activity, including fixed assets and current assets (such as accounts receivable and inventories). The following items are excluded from operating assets: cash, cash equivalents, short-term investments, deferred tax assets, tax refunds, intangibles, investments in subsidiaries, portfolio investments. |
| Operating expenses | All expenses (including depreciation) not included in cost of goods sold except for interest expense, domestic and foreign income taxes, amortization of intangibles, and any other expenses not related to the operation of the relevant business activity. Operating expenses normally include, for example, expenses associated with advertising, promotion, sales, marketing, warehousing and distribution, administration, and a reasonable allowance for depreciation. For U.S. Taxpayer, foreign income taxes are defined in U.S. Treasury Regulations section 1.902-1(a)(7). |
| Operating margin | The ratio of operating profit to sales revenue. |
| Operating profit | Sales revenue, less cost of goods sold for the relevant business activity, less operating expenses. |
| Rev. Proc. 99-32 | A revenue procedure issued by the IRS that is cited as Rev. Proc. 99-32, 1999-2 C.B. 296. |
| Rev. Proc. 2015-41 | A revenue procedure issued by the IRS that is cited as Rev. Proc. 2015-41, 2015-35 I.R.B 263. |
| Repatriable Issue | (Defined in section 6 of this Appendix A.) |
| Relevant Financial Data | With respect to a particular Covered Method, the financial results of the Tested Party that are tested, together with any other financial data (of the Tested Party or any other party) that are considered in determining compliance with the Covered Method. |
| Return on invested capital | (Defined in the same way as “return on operating assets,” but with “operating assets” replaced by “invested capital” wherever it occurs in the definition.) |
| Return on operating assets | With respect to a particular Covered Method, the Tested Party for that Covered Method, and a testing period used in that Covered Method, the operating profit over the testing period divided by the time-weighted average operating assets over the testing period. For this purpose, the time-weighted average operating assets over the testing period is the sum, over all APA Covered Years in the testing period, of the following product: (i) the simple average of the operating asset levels at the start and end of the APA Tax Year corresponding to such APA Covered Year, multiplied by (ii) the ratio of the number of calendar days in the APA Covered Year, to 365. For example, suppose that (i) the testing period consists of two consecutive APA Covered Years, the first with 183 calendar days and the second with 366 calendar days, (ii) the total operating profit over those two years is exactly 3.4, and (iii) the operating assets levels are exactly 10 at the start of the APA tax year corresponding to the first APA Covered Year, 16 at the end of the APA Tax Year corresponding to the first APA Covered Year (which is also the start of the APA Tax Year corresponding to the second APA Covered Year), and 22 at the end of the APA Tax Year corresponding to the second APA Covered Year. Then the time-weighted average operating assets over the testing period is [(10+16)/2]*(183/365) + [(16+22)/2]*(366/365) = 25.5699. The return on operating assets is then 3.4/25.5699 = 13.30%. |
| Rollback Period | (This term, if applicable, is defined in section 2 of this Appendix A.) |
| Sales revenue | Total receipts from sale of goods and provision of services, less returns and allowances, for the relevant business activity. |
| Tax year | A standard or irregular year that is used for tax reporting purposes. For U.S. Taxpayer, a tax year is a “taxable year,” as defined in Code section 441. |
| Tested Party | (Defined in section 4 of this Appendix A with regard to a particular Covered Method.) |
| Testing period | The time period over which financial results are tested (see section 4 of Appendix A to this APA). |
| Total costs | Cost of goods sold for the relevant business activity, plus operating expenses. |
| U.S. Treasury Regulations | Tax regulations issued by the U.S. Treasury Department, found at title 26 of the Code of Federal Regulations. |
| U.S. Covered Entity(ies) | (Defined in section 1 of this Appendix A.) |
| U.S. Effective Date | The date, or later date of the dates, upon which the APA is executed by the IRS and by or on behalf of each U.S. Covered Entity. |
| U.S. GAAP | U.S. generally accepted accounting principles. |
| U.S. return | Any of the “Returns with respect to income taxes under subtitle A” required by Code section 6012, and any “return” for a partnership required by Code section 6031. |
| U.S. Taxpayer | (Defined in section 1 of this Appendix A.) |
The Critical Assumptions are:
1. The Covered Entities’ business activities, functions performed, risks assumed, assets employed, contractual terms, markets, and economic conditions faced in relation to the Covered Issue(s) will remain materially the same as described in the APA Request. For this purpose, a mere change in business results will not be a material change.
2. The Covered Entities’ financial accounting methods and classifications and methods of estimation in relation to the Covered Issue(s) and Covered Method(s) will remain materially the same as described or used in the APA Request.
If indicated, the effect of a critical assumption failure may be limited as follows:
[] The failure of Critical Assumptions #XXX listed above will affect the effectiveness of this APA only as to Covered Issues #YYY listed in Appendix A. Thus, as to the other Covered Issues, the APA will remain in force (except to the extent some other condition affects the APA’s effectiveness as to those Covered Issues).
The Covered Entities will not cause a critical assumption to fail for the purpose of rendering the APA ineffective, unless they have an independent business justification (unrelated to rendering the APA ineffective) for the action that causes the critical assumption to fail. If one or more Covered Entities do cause a critical assumption to fail for the purpose of rendering the APA ineffective, and without such independent business justification, then the Covered Entities will not withhold consent to an amendment to this APA to the effect that this APA will continue in force without regard to such failure. In this case, if a Covered Entity refuses to sign such an amendment, such an amendment may be executed without such signature and will then have the same force and effect as if the amendment had such signature.
The APA Records will consist of all documents listed below for inclusion in the Annual Report, as well as all documents, notes, work papers, records, or other writings that support the information provided in such documents.
An Annual Report must be submitted for each APA Tax Year in accordance with paragraph 6(e) of the APA and section 7.02 of Rev. Proc. 2015-41.
For each APA Tax Year, the Annual Report (and each copy or version as required by paragraph 6(e) of the APA) will include:
1. Two copies of a properly completed APA Annual Report Summary in the form of Appendix D to this APA, one copy of the form bound with, and one copy provided separately from, the rest of the Annual Report. (The electronic version of the Annual Report need have only one copy of this item.)
2. A table of contents, organized according to the additional required items listed below.
3. For such APA Tax Year and the corresponding APA Covered Year, statements that fully identify, describe, analyze, and explain:
a. All material differences between the Covered Entities’ business activities, functions performed, risks assumed, assets employed, contractual terms, markets, and economic conditions faced in relation to the Covered Issues during such APA Covered Year from those same items described in the APA Request. If there have been no such material differences, the Annual Report will include a statement to that effect.
b. All material differences between Covered Entities’ financial accounting methods and classifications and methods of estimation in relation to the Covered Issues and Covered Methods used during such APA Covered Year, from those described or used in the APA Request. If any change was made to conform to changes in the Applicable Accounting Standard, U.S. Taxpayer will specifically identify the change. If there have been no such material differences, the Annual Report will include a statement to that effect.
c. Regarding notices under paragraph 16 of the APA:
i. A current statement of how the IRS should provide such notices to U.S. Taxpayer (and, if applicable, to U.S. Taxpayer’s representative).
ii. A copy of any such notices that were submitted by U.S. Taxpayer to the IRS after the last Annual Report was submitted (or, if there was no prior Annual Report, after the APA was executed). If there were no such notices, the Annual Report will include a statement to that effect.
d. Any failure of any Critical Assumption. If there has been no such failure, the Annual Report will include a statement to that effect.
e. Whether or not material information submitted while the APA Request was pending is discovered to be false, incorrect, or incomplete, and if so a correction or completion of that information, as applicable.
f. Any change to any entity classification for federal income tax purposes (including any change that causes an entity to be disregarded for federal income tax purposes) of any Worldwide Group member that is a Covered Entity or is otherwise relevant to the Covered Issue(s) or Covered Method(s).
g. The following regarding any APA Primary Adjustments made for such APA Tax Year under Appendix A to this APA:
i. The amounts of any APA Primary Adjustments;
ii. The circumstances that led to such APA Primary Adjustments being necessary;
iii. A calculation of the net APA Primary Adjustment as defined in Appendix A to this APA; and
iv. A complete description of the means by which the conforming adjustment (see section 6 of Appendix A to this APA) is accomplished, including:
A. a description of any accounts payable established, including the entities involved and when the payables are established;
B. a description of any amounts paid or deemed paid (including amounts paid or deemed paid in satisfaction of an intercompany payable established as described in section 6 of Appendix A to this APA, and including any deemed reverse payments as described in section 6 of Appendix A to this APA), that specifies the entities involved, when the amounts are paid or deemed paid, and by what means any amounts are actually paid; and
C. the character (such as capital, ordinary, income, expense, dividend, contribution to capital) and country source of any payments and deemed payments, and the specific affected line item(s) of any affected U.S. return;
h. A detailed numerical explanation of how the result of the application of the Covered Methods is reflected on the U.S. return, with reference to particular line items on the U.S. return. This explanation shall include the amounts, description, reason for, and financial analysis of any book-tax differences, as reflected on Schedule M-1 or Schedule M-3 of the U.S. return for such APA Tax Year, that (i) are relevant to an APA Primary Adjustment, (ii) otherwise are relevant to the book and tax treatment of any income or expense item that is part of the Relevant Financial Data for, or is determined by, any Covered Method for such APA Tax Year, or (iii) otherwise are relevant to the APA. U.S. Taxpayer shall not simply attach a copy of the pertinent schedule. Rather, U.S. Taxpayer shall specifically identify the relevant items from that schedule and shall describe in appropriate detail the nature of those items, how they arose, and how they are accounted for.
i. Whether or not U.S. Taxpayer contemplates requesting, or has requested, to renew, modify, or cancel the APA.
4. The Financial Statements and additional statements required under paragraph 6(f) of the APA, for such APA Tax Year and for any other tax year whose financial data are relevant to compliance with the APA for such APA Tax Year;
5. A financial analysis that includes U.S. Taxpayer’s calculations to apply the Covered Method(s) to the Covered Issue(s) for such APA Covered Year and supports those calculations with additional material that ties those calculations to the Financial Statements. The intent of this requirement is that the analysis submitted should provide a clear, complete, detailed, and self-contained means by which the IRS can verify compliance with the Covered Method(s). This requirement is further explained as follows:
a. The additional material must support every numerical input to U.S. Taxpayer’s calculations.
b. The additional material could include, for example, consolidating financial statements, segmented financial data, and records from the general ledger.
c. Where segmented data are used, U.S. Taxpayer must specify in detail how it accomplished the segmentation, including how it made allocations and apportionments, including (i) the definition and calculation of any apportionment keys used, and (ii) the calculations applying such keys. The inputs used for those various calculations must be tied to the Financial Statements.
d. The additional material must be annotated sufficiently to let the IRS easily trace U.S. Taxpayer’s entire calculations to objective, verifiable sources of data.
e. Where needed for clarity, terms must be defined.
6. The financial results pertinent to the Covered Method(s), for such APA Covered Year and all prior years, entered along with data concerning the Covered Method(s) in an electronic results template available by contacting APMA.
7. [] An organizational chart for Worldwide Group, revised annually to reflect all ownership or structural changes of the Covered Entities and any other entities that are relevant to the Covered Issue(s) or are otherwise relevant to the Covered Method(s).
[]* An organizational chart for a part of Worldwide Group that includes all Covered Entities and includes any other entities relevant to the Covered Issue(s) or Covered Method(s), revised annually to reflect all ownership or structural changes of entities that are involved in the Covered Issue(s) or are otherwise relevant to the Covered Issue(s) or Covered Method(s).
8. A valid IRS Form 2848 “Power of Attorney and Declaration of Representative” for any representative to receive notices under paragraph 16 of this APA.
9. A copy of the APA and any amendment.
10. A penalty of perjury statement, executed in accordance with Rev. Proc. 2015-41, sections 7.02(8) and (9).
The APA Annual Report Summary on the next page is a required APA Record. APMA supplies some of the information requested on the form. U.S. Taxpayer is to supply the remaining information requested by the form and submit the form as part of its Annual Report.
| Internal Revenue Service | APMA Case No. | |
| Large Business and International Division | Reviewer | |
| Treaty & Transfer Pricing Operations | Team Leader | |
| Advance Pricing Mutual Agreement Program | Economist | |
| Other APA Team Members |
APA Information
| U.S. Taxpayer’s Name | |
| U.S. Taxpayer’s EIN | |
| U.S. Taxpayer’s NAICS | |
| Unilateral/Bilateral/Multilateral | |
| Original or Renewal | |
| APA Common Name, if any | |
| APA Request Filing Date | |
| Date APA Executed | |
| APA Term (date-to-date, inclusive) | |
| Foreign Countr(y)ies Involved | |
| Annual Report Due Dates for years ending on or before [date]: | |
| Annual Report Due Dates for other years: [last month of tax year] 15 following close of year | |
| Covered Methods Summary Description | |
| (e.g., CPM, operating margin 2%-5%) | |
| Taxpayer’s Principal Representative | |
APA Annual Report Information:
| Year(s) covered by this Annual Report | ||
| Issues for APMA’s special attention (or “None”) | ||
| Taxpayer Notice Person | Name | |
| Title | ||
| If necessary, include a | Address | |
| current Form 2848 for the | City/State/Zip | |
| Notice Person | Phone/Fax | |
| Current Representative, if any | Name | |
| Title | ||
| Include a current Form 2848 | Address | |
| for the representative | City/State/Zip | |
| Phone/Fax | ||
Date Annual Report Filed (to be filled in by APMA):
This announcement notifies taxpayers that amounts paid for personal protective equipment, such as masks, hand sanitizer and sanitizing wipes, for the primary purpose of preventing the spread of the Coronavirus Disease 2019 (COVID-19 PPE) are treated as amounts paid for medical care under § 213(d) of the Internal Revenue Code (Code). Therefore, amounts paid by an individual taxpayer for COVID-19 PPE for use by the taxpayer, the taxpayer’s spouse, or the taxpayer’s dependent(s) that are not compensated for by insurance or otherwise are deductible under § 213(a) provided that the taxpayer’s total medical expenses exceed 7.5 percent of adjusted gross income.
Because these amounts are expenses for medical care under § 213(d) of the Code, the amounts are also eligible to be paid or reimbursed under health flexible spending arrangements (health FSAs), Archer medical savings accounts (Archer MSAs), health reimbursement arrangements (HRAs), or health savings accounts (HSAs). However, if an amount is paid or reimbursed under a health FSA, Archer MSA, HRA, HSA or any other health plan, it is not deductible under § 213.
Group health plans, including health FSAs and HRAs, under the terms of which expenses for COVID-19 PPE may not be reimbursed, may be amended pursuant to this announcement to provide for reimbursements of expenses for COVID-19 PPE incurred for any period beginning on or after January 1, 2020, and such an amendment will not be treated as causing a failure of any reimbursement to be excludable from income under § 105(b) or as causing a § 125 cafeteria plan to fail to meet the requirements of § 125. Group health plans may be amended pursuant to this announcement if the amendment is adopted not later than the last day of the first calendar year beginning after the end of the plan year in which the amendment is effective, no amendment with retroactive effect is adopted after December 31, 2022, and the plan is operated consistent with the terms of the amendment, including during the period beginning on the effective date of the amendment through the date the amendment is adopted.
The principal author of this announcement is Amy S. Wei of the Office of Associate Chief Counsel (Income Tax and Accounting). For further information concerning this announcement, contact Ms. Wei at (202) 317-7011 (not a toll-free number).
The contents of this publication are not copyrighted and may be reprinted freely. A citation of the Internal Revenue Bulletin as the source would be appropriate.
Revenue rulings and revenue procedures (hereinafter referred to as “rulings”) that have an effect on previous rulings use the following defined terms to describe the effect:
Amplified describes a situation where no change is being made in a prior published position, but the prior position is being extended to apply to a variation of the fact situation set forth therein. Thus, if an earlier ruling held that a principle applied to A, and the new ruling holds that the same principle also applies to B, the earlier ruling is amplified. (Compare with modified, below).
Clarified is used in those instances where the language in a prior ruling is being made clear because the language has caused, or may cause, some confusion. It is not used where a position in a prior ruling is being changed.
Distinguished describes a situation where a ruling mentions a previously published ruling and points out an essential difference between them.
Modified is used where the substance of a previously published position is being changed. Thus, if a prior ruling held that a principle applied to A but not to B, and the new ruling holds that it applies to both A and B, the prior ruling is modified because it corrects a published position. (Compare with amplified and clarified, above).
Obsoleted describes a previously published ruling that is not considered determinative with respect to future transactions. This term is most commonly used in a ruling that lists previously published rulings that are obsoleted because of changes in laws or regulations. A ruling may also be obsoleted because the substance has been included in regulations subsequently adopted.
Revoked describes situations where the position in the previously published ruling is not correct and the correct position is being stated in a new ruling.
Superseded describes a situation where the new ruling does nothing more than restate the substance and situation of a previously published ruling (or rulings). Thus, the term is used to republish under the 1986 Code and regulations the same position published under the 1939 Code and regulations. The term is also used when it is desired to republish in a single ruling a series of situations, names, etc., that were previously published over a period of time in separate rulings. If the new ruling does more than restate the substance of a prior ruling, a combination of terms is used. For example, modified and superseded describes a situation where the substance of a previously published ruling is being changed in part and is continued without change in part and it is desired to restate the valid portion of the previously published ruling in a new ruling that is self contained. In this case, the previously published ruling is first modified and then, as modified, is superseded.
Supplemented is used in situations in which a list, such as a list of the names of countries, is published in a ruling and that list is expanded by adding further names in subsequent rulings. After the original ruling has been supplemented several times, a new ruling may be published that includes the list in the original ruling and the additions, and supersedes all prior rulings in the series.
Suspended is used in rare situations to show that the previous published rulings will not be applied pending some future action such as the issuance of new or amended regulations, the outcome of cases in litigation, or the outcome of a Service study.
The following abbreviations in current use and formerly used will appear in material published in the Bulletin.
A—Individual.
Acq.—Acquiescence.
B—Individual.
BE—Beneficiary.
BK—Bank.
B.T.A.—Board of Tax Appeals.
C—Individual.
C.B.—Cumulative Bulletin.
CFR—Code of Federal Regulations.
CI—City.
COOP—Cooperative.
Ct.D.—Court Decision.
CY—County.
D—Decedent.
DC—Dummy Corporation.
DE—Donee.
Del. Order—Delegation Order.
DISC—Domestic International Sales Corporation.
DR—Donor.
E—Estate.
EE—Employee.
E.O.—Executive Order.
ER—Employer.
ERISA—Employee Retirement Income Security Act.
EX—Executor.
F—Fiduciary.
FC—Foreign Country.
FICA—Federal Insurance Contributions Act.
FISC—Foreign International Sales Company.
FPH—Foreign Personal Holding Company.
F.R.—Federal Register.
FUTA—Federal Unemployment Tax Act.
FX—Foreign corporation.
G.C.M.—Chief Counsel’s Memorandum.
GE—Grantee.
GP—General Partner.
GR—Grantor.
IC—Insurance Company.
I.R.B.—Internal Revenue Bulletin.
LE—Lessee.
LP—Limited Partner.
LR—Lessor.
M—Minor.
Nonacq.—Nonacquiescence.
O—Organization.
P—Parent Corporation.
PHC—Personal Holding Company.
PO—Possession of the U.S.
PR—Partner.
PRS—Partnership.
PTE—Prohibited Transaction Exemption.
Pub. L.—Public Law.
REIT—Real Estate Investment Trust.
Rev. Proc.—Revenue Procedure.
Rev. Rul.—Revenue Ruling.
S—Subsidiary.
S.P.R.—Statement of Procedural Rules.
Stat.—Statutes at Large.
T—Target Corporation.
T.C.—Tax Court.
T.D.—Treasury Decision.
TFE—Transferee.
TFR—Transferor.
T.I.R.—Technical Information Release.
TP—Taxpayer.
TR—Trust.
TT—Trustee.
U.S.C.—United States Code.
X—Corporation.
Y—Corporation.
Z—Corporation.
Bulletin 2021–15
Notices:
| Article | Issue | Link | Page |
|---|---|---|---|
| 2021-01 | 2021-02 I.R.B. | 2021-02 | 315 |
| 2021-03 | 2021-02 I.R.B. | 2021-02 | 316 |
| 2021-04 | 2021-02 I.R.B. | 2021-02 | 319 |
| 2021-02 | 2021-03 I.R.B. | 2021-03 | 478 |
| 2021-05 | 2021-03 I.R.B. | 2021-03 | 479 |
| 2021-07 | 2021-03 I.R.B. | 2021-03 | 482 |
| 2021-09 | 2021-05 I.R.B. | 2021-05 | 678 |
| 2021-06 | 2021-06 I.R.B. | 2021-06 | 822 |
| 2021-08 | 2021-06 I.R.B. | 2021-06 | 823 |
| 2021-11 | 2021-06 I.R.B. | 2021-06 | 827 |
| 2021-12 | 2021-06 I.R.B. | 2021-06 | 828 |
| 2021-13 | 2021-06 I.R.B. | 2021-06 | 832 |
| 2021-10 | 2021-07 I.R.B. | 2021-07 | 888 |
| 2021-15 | 2021-10 I.R.B. | 2021-10 | 898 |
| 2021-16 | 2021-10 I.R.B. | 2021-10 | 907 |
| 2021-18 | 2021-11 I.R.B. | 2021-11 | 911 |
| 2021-19 | 2021-11 I.R.B. | 2021-11 | 920 |
| 2021-20 | 2021-11 I.R.B. | 2021-11 | 922 |
| 2021-17 | 2021-14 I.R.B. | 2021-14 | 984 |
| 2021-21 | 2021-15 I.R.B. | 2021-15 | 986 |
| 2021-22 | 2021-15 I.R.B. | 2021-15 | 987 |
Revenue Procedures:
| Article | Issue | Link | Page |
|---|---|---|---|
| 2021-01 | 2020-01 I.R.B. | 2020-01 | 1 |
| 2021-02 | 2020-01 I.R.B. | 2020-01 | 116 |
| 2021-03 | 2020-01 I.R.B. | 2020-01 | 140 |
| 2021-04 | 2020-01 I.R.B. | 2020-01 | 157 |
| 2021-05 | 2020-01 I.R.B. | 2020-01 | 250 |
| 2021-07 | 2020-01 I.R.B. | 2020-01 | 290 |
| 2021-09 | 2020-03 I.R.B. | 2020-03 | 485 |
| 2021-08 | 2020-04 I.R.B. | 2020-04 | 502 |
| 2021-10 | 2020-04 I.R.B. | 2020-04 | 503 |
| 2021-12 | 2020-05 I.R.B. | 2020-05 | 681 |
Treasury Decisions:
| Article | Issue | Link | Page |
|---|---|---|---|
| 9925 | 2021-02 I.R.B. | 2021-02 | 296 |
| 9940 | 2021-02 I.R.B. | 2021-02 | 311 |
| 9932 | 2021-03 I.R.B. | 2021-03 | 345 |
| 9939 | 2021-03 I.R.B. | 2021-03 | 376 |
| 9941 | 2021-03 I.R.B. | 2021-03 | 396 |
| 9942 | 2021-03 I.R.B. | 2021-03 | 450 |
| 9937 | 2021-04 I.R.B. | 2021-04 | 495 |
| 9936 | 2021-05 I.R.B. | 2021-05 | 508 |
| 9943 | 2021-05 I.R.B. | 2021-05 | 577 |
| 9945 | 2021-05 I.R.B. | 2021-05 | 627 |
| 9946 | 2021-06 I.R.B. | 2021-06 | 726 |
| 9947 | 2021-06 I.R.B. | 2021-06 | 748 |
| 9948 | 2021-06 I.R.B. | 2021-06 | 801 |
| 9938 | 2021-07 I.R.B. | 2021-07 | 838 |
1 A cumulative list of all revenue rulings, revenue procedures, Treasury decisions, etc., published in Internal Revenue Bulletins 2020–27 through 2020–52 is in Internal Revenue Bulletin 2020–52, dated December 27, 2020.
The Introduction at the beginning of this issue describes the purpose and content of this publication. The weekly Internal Revenue Bulletins are available at www.irs.gov/irb/.
If you have comments concerning the format or production of the Internal Revenue Bulletin or suggestions for improving it, we would be pleased to hear from you. You can email us your suggestions or comments through the IRS Internet Home Page www.irs.gov) or write to the
Internal Revenue Service, Publishing Division, IRB Publishing Program Desk, 1111 Constitution Ave. NW, IR-6230 Washington, DC 20224.